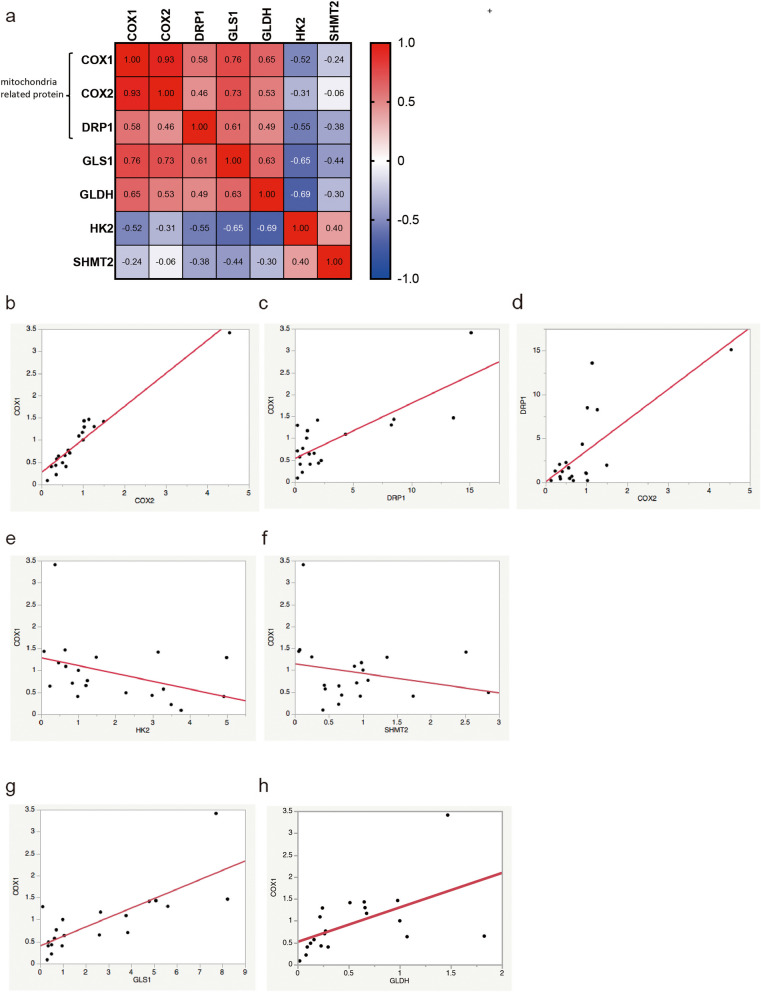
Fig. 2.
Interaction between mitochondria and other pathway-related proteins. Mitochondria-related protein expression levels are correlated. a Correlation coefficient between each protein. The correlation values (r) are calculated using the Spearman method using GraphPad Prism version 9. b COX1 expression correlates with COX2 expression (r = 0.93). c COX1 expression correlates with DRP1 expression (r = 0.56). d COX2 expression correlates with DRP1 expression (r = 0.46). Mitochondria-related protein expression levels are inversely correlated with glycolytic protein expression levels. e COX1 expression tends to be inversely correlated with that of HK2 (r = -0.52). Mitochondria-related protein expression is not correlated with that of one-carbon metabolism proteins. f COX1 expression is not correlated with that of SHMT2 (r = -0.24). Mitochondria-related protein expression is correlated with that of glutaminolysis-related proteins. g COX1 expression is correlated with GLS1 (r = 0.76). h COX1 expression is correlated with GLDH (r = 0.65)

