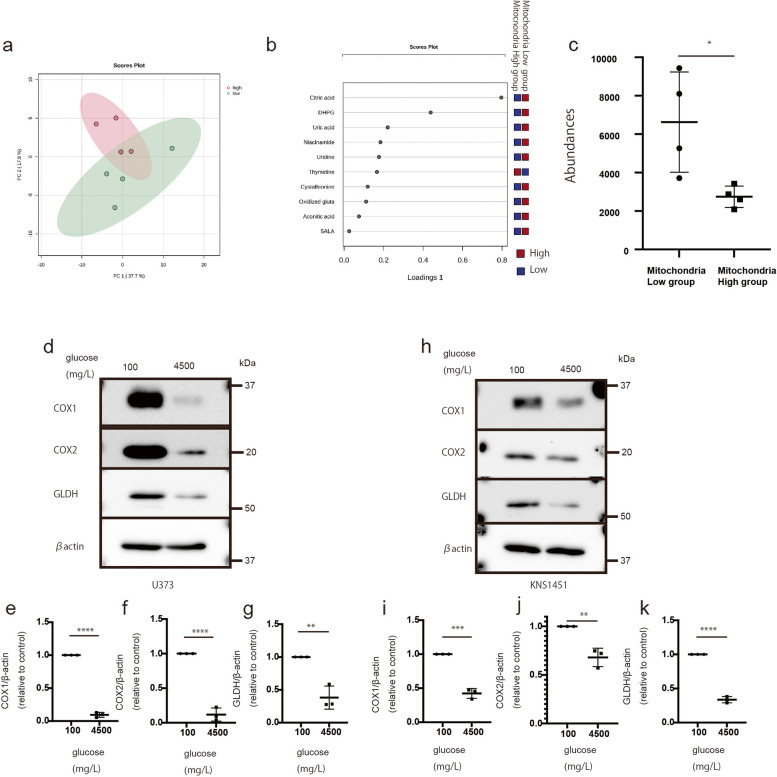
Fig. 4.
Mass spectrometry analysis of the tumor sample comparing the correlation of glycolytic- and mitochondria-type tissue proteins with glutaminolysis protein levels under glucose starvation. a Schema of the differences between the sample with high expression of mitochondria-related proteins and the sample with low expression of mitochondria-related proteins using the PCA method. b One of the main metabolome compounds distinguishing between glycolytic- and mitochondria-type tissue using the sPLS-DA method. c Quantitative value of citric acid levels in each group (P < 0.05). Values are presented as the mean ± SD. The Mann–Whitney test was performed for comparison between the low group vs. the high group (*P < 0.05). d–k Expression of mitochondrial and glutaminolysis proteins under different glucose concentrations. d expression of COX1, COX2, GLDH, and actin in U373. e–g Quantification of COX1 (e), COX2 (f), and GLDH (g), normalized to the expression of β-actin (h). Expression of COX1, COX2, GLDH, and actin in KNS1451. i–k Quantification of COX1 (i), COX2 (j), and GLDH (k), normalized to the expression of β-actin. Values are presented as the mean ± SD. A Student’s t-test was performed to compare conditions of 100 vs. 4,500 mg/L of glucose. **P < 0.01; ***P < 0.001 ****P < 0.0001

