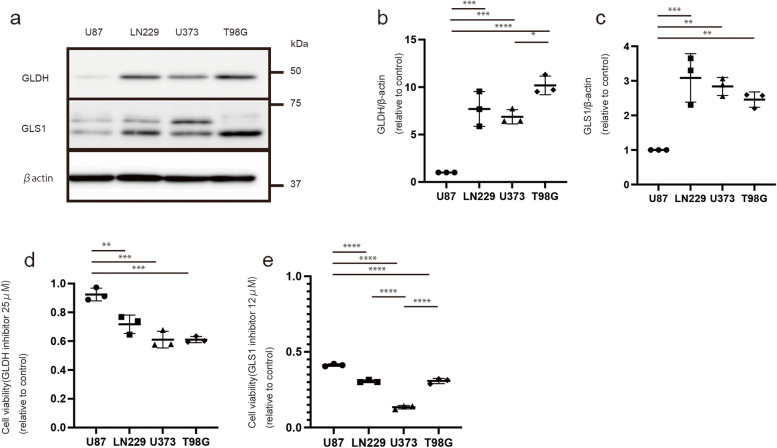
Fig. 5.
Expression of glutaminolysis proteins (GLDH and GLS1) and the effectiveness of their inhibitors (GLDH and GLS1 inhibitors) in each cell line. a GLDH and GLS1 expressions in U87, LN229, U373, and T98G. b Quantification of GLDH expression, normalized to the expression of β-actin. c Quantification of GLS1 expression, normalized to the expression of β-actin. d Cell number (relative to control) following the administration of the 25 μM GLDH(R162) inhibitor for 72 h. e Cell number (relative to control) following the administration of the 12 μM GLS1(BPTES) inhibitor for 72 h. Values are presented as the mean ± SD. One-way ANOVA and Tukey’s multiple comparison tests were performed for comparisons between U87 vs. LN229, U373, and T98G. *P < 0.05, **P < 0.01; ***P < 0.001 ****P < 0.0001

