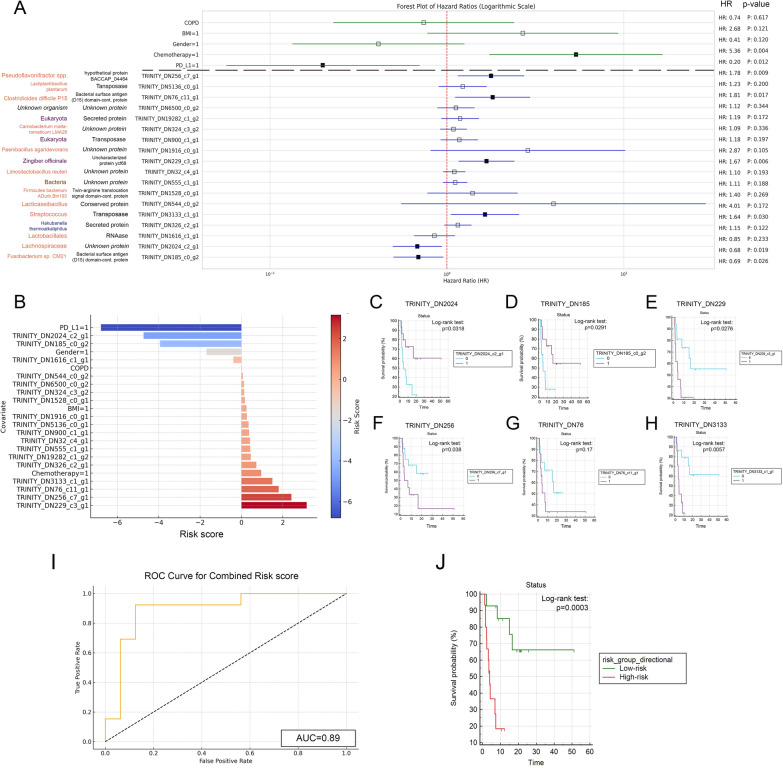
Fig. 7.
Assessment of PFS associations with microbial gene transcripts and clinical covariates. A Univariate Cox regression on 120 gene transcripts and clinical covariates identified 18 genes significantly associated with PFS. Further multivariate analysis, adjusting for CHT and PD-L1 TPS as confounders, highlighted six genes with significant predictive value for PFS. Notably, a Fusobacterium species protein (HR: 0.69, p = 0.026) and a Lachnospiraceae protein (HR: 0.68, p = 0.029) were positively associated with PFS. In contrast, four others, including ribosomal protein S12 (HR: 1.64, p = 0.03) and uncharacterized protein ycf68 (HR: 1.67, p = 0.006) from unknown Eukaryota species, a bacterial surface antigen (D15) domain-containing protein (HR: 1.81, p = 0.017), and an unknown protein (HR: 1.78, p = 0.009) from unknown organisms were negatively associated with PFS. B Risk scores calculated for all covariates and biomarkers are shown on bar charts, where positive values indicate higher risk-, negative values indicate lower risk of progression. C–H KM curves for RNA transcripts with top 6 risk scores and significant p-values for multivariate Cox regression compare biomarker-high vs low populations (cut-off: median abundance value). p-values for the Log-rank test are indicated along with censored data on charts (0 = biomarker-low group, 1 = biomarker-high group). I ROC curve analysis shows the predictive power of combined risk score (AUC = 0.89). J KM analysis shows that patients in the low-risk group exhibit significantly increased survival compared to high-risk patients (p = 0.0003). HR: Hazard ratio

