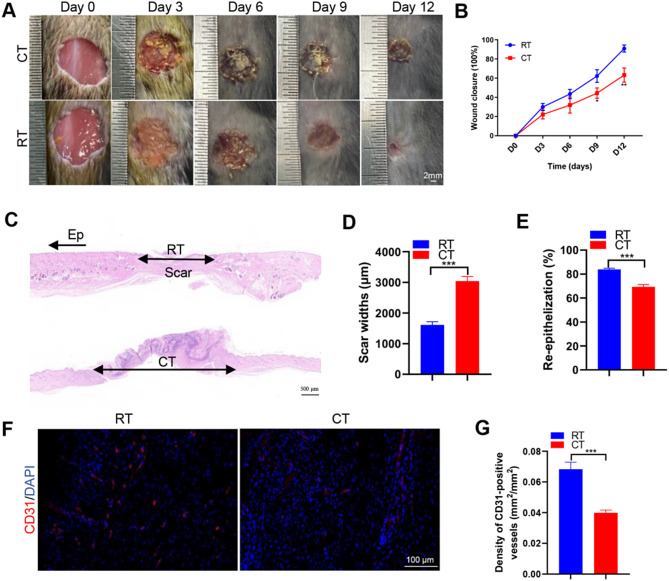
Fig. 1.
Delayed wound healing in the CT environment. (A) Gross view of wounds treated with RT or CT at day 3, 6, 9 and 12 post-wounding. (B) The rate of wound closure in wounds receiving different RT or CT treatments, with n = 6 per group. (C) Representative images of H&E-stained wound sections at day 12 post-wounding. Double-headed black arrows indicate the edges of the scars. Ep: epithelium. Scale bar: 500 μm. (D) Quantification of the scar widths, n = 4 per group. (E) Quantification of the rate of re-epithelialization, n = 4 per group. (F) CD31 immunofluorescence staining of wound sections at day 12 post-wounding. Scale bar: 100 μm. (G) Quantitative analysis of the density of blood vessels in (F), n = 4 per group. Two-group comparison was performed using unpaired, two tailed student’s t-test. *p < 0.05; **p < 0.01; ***p < 0.001

