Fig. 4.
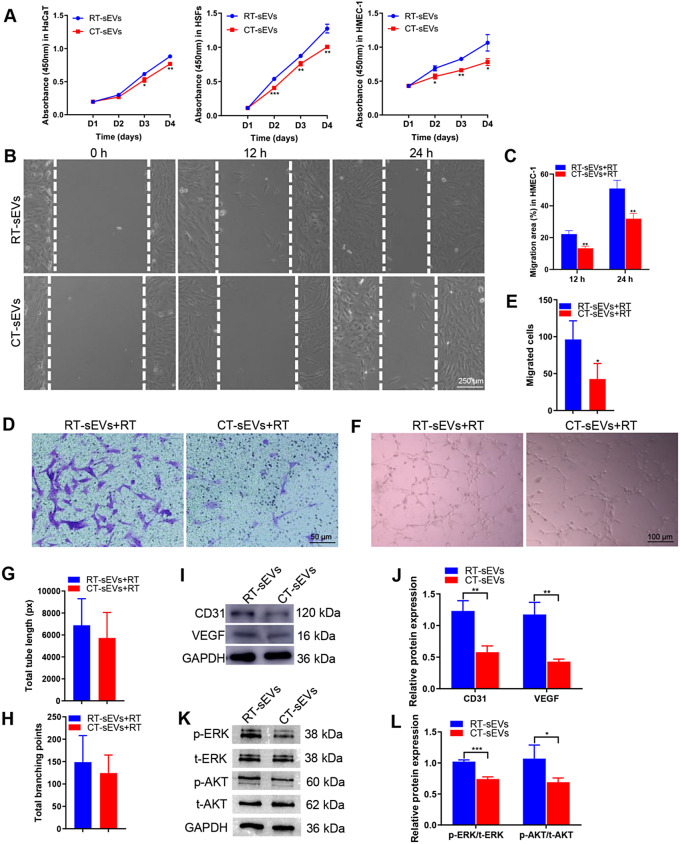
CT-sEVs inhibited the proliferation and migration and angiogenic activities in vitro. (A) HaCaT, HSFs and HMEC-1 exhibited a much weaker proliferative ability when exposed to CT-sEVs, as tested by CCK-8 analysis, n = 4 per group. (B) CT-sEVs inhibited HMEC-1 migration as analyzed by scratch wound assay. Scale bar: 250 μm. (C) Quantitative analysis of the migration rates in (B), n = 4 per group. (D) The migratory ability of HMEC-1 receiving different treatments was further confirmed by the transwell assay. Scale bar: 50 μm. (E) Quantitative analysis of the migrated cells in (D), n = 4 per group. (F) Representative images of HMEC-1 tube formation. Scale bar: 100 μm. (G and H) Quantification of the total tube length and total branching points, n = 4 per group. (I and J) CT-sEVs incubation reduced the protein levels of CD31, VEGF, p-ERK and p-AKT in HEMC-1. (K and L) Densitometric quantification of the relative band intensity in (J and L), n = 4 per group. Two-group comparison was performed using unpaired, two tailed student’s t-test. *p < 0.05; **p < 0.01; ***p < 0.001

