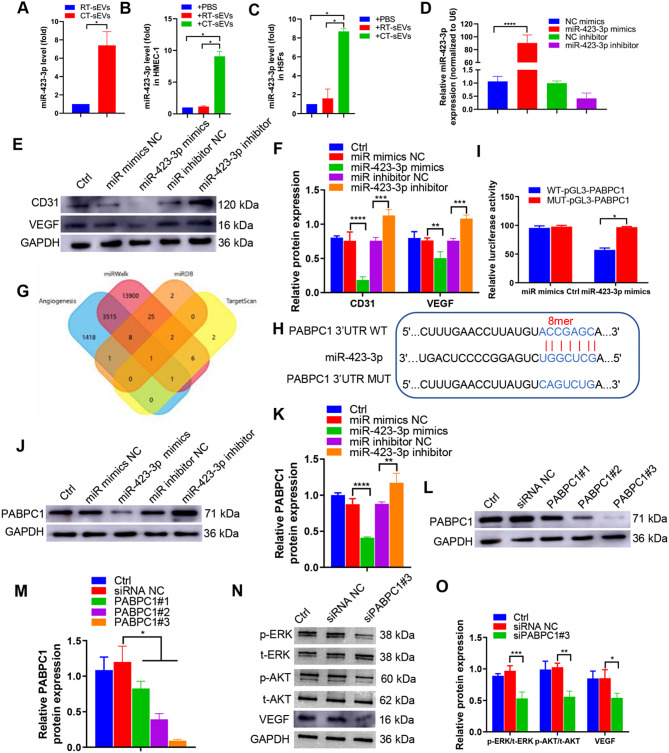
Fig. 5.
miR-423-3p mediated the anti-angiogenic effect of CT-sEVs by targeting PABPC1. (A) qRT-PCR analysis of miR-423-3p expression in sEVs from the plasma of the RT or CT mice (n = 6). (B-C) qRT-PCR analysis of miR-423-3p expression in HMEC-1 (B) and HSFs (C) from RT-sEVs or CT-sEVs (n = 6). (D) qRT-PCR was performed to evaluate the expression of miR-423-3p in HMEC-1 transfected with specific miR-423-3p mimics or inhibitor (n = 4). (E) Western blotting was performed to determine the protein expression levels of CD31 and VEGF in HMEC-1 cells transfected with specific miR-423-3p mimics or inhibitors (n = 4). (F) The data are presented as densitometric ratios, normalised to GAPDH. (G) A Venn diagram showing bioinformatics analysis of miR-423-3p target genes. (H) Schematic representation of miR-423-3p putative target sites in the PABPC1 3′-UTR and the alignment of miR-423-3p with wild type and mutant PABPC1 3′-UTR showing pairing. (I) Luciferase reporter assays were performed using luciferase constructs carrying a wild type or mutant PABPC1 3′-UTR co-transfected into HMEC-1 with miR-423-3p mimics compared with empty vector control. Firefly luciferase activity was normalised to Renilla luciferase activity. (J and K) PABPC1 protein expression in HMEC-1 transfected with miR-423-3p mimics or miR-423-3p inhibitor was determined by Western blotting (n = 4). (L and M) The efficiency of PABPC1 knockdown in HMEC-1 by siRNA was measured by Western blotting (n = 4). (N and O) p-ERK, p-AKT and VEGF expression was measured in the HMEC-1 cells treated with siPABPC1#3 or a siRNA control (n = 4). Two-group comparison was performed using unpaired, two tailed student’s t-test. One-way ANOVA combined with Bonferroni post hoc test. *p < 0.05; **p < 0.01; ***p < 0.001; ****p < 0.0001

