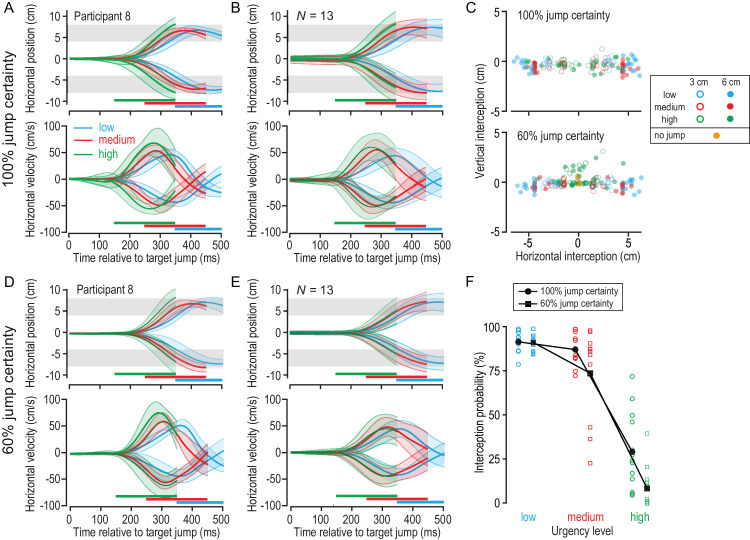
Figure 5.
Hand responses in the rapid interception task. (A) Horizontal hand position (top) and velocity (bottom) across time for low (blue), medium (red), and high (green) urgency trials shown for an exemplar participant in the high-certainty condition. The gray-shaded areas represent the region in which the paddle could intercept the target. The horizontal, colored bars indicate the time period in which the target had to be intercepted for each urgency level. (B) Corresponding plots averaged across all participants in the high-certainty condition. (C) Hand position at the time of interception or when the missed target left the screen in the high-certainty (top) and low-certainty (bottom) conditions. Open circles indicate 3-cm jump trials and filled circles indicate 6-cm jump trials. Color denotes urgency level, and purple indicates trials in which the target did not jump. (D, E) Plots of horizontal hand position and velocity across time for an exemplary participant (D) and averaged across all participants (E) in the low-certainty condition. (F) Probability of intercepting the moving target following a target jump in the high-certainty (circles) and low-certainty (squares) jump conditions and across urgency levels.

