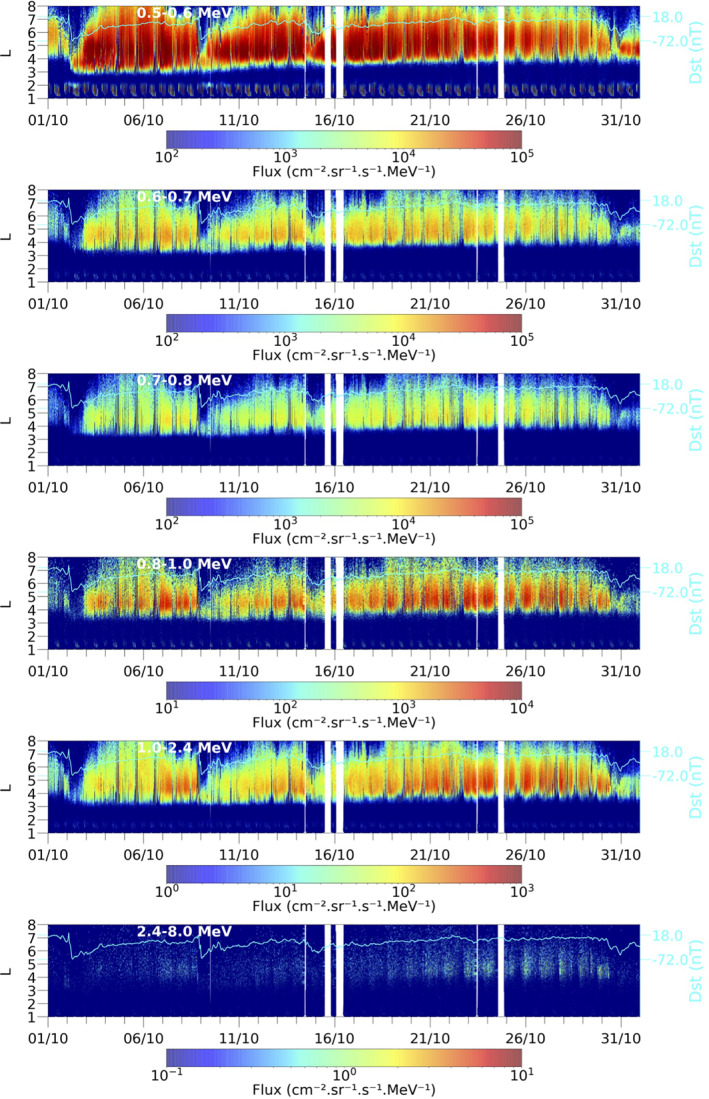
Figure 6.

Electron fluxes observed by EPT from September 30, 2013 up to November 2, 2013, as a function of the McIlwain parameter L (vertical axis) and time (horizontal axis) for each energy channel, from top to bottom: channel 1 (500–600 keV), channel 2 (600–700 keV), channel 3 (700–800 keV), channel 4 (800–1,000 keV), channel 5 (1,200–2,400 keV), and channel 6 (2,400–8,000 keV). The observed Dst (Disturbed Storm Time) index is superposed in each panel (right scale). EPT, energetic particle telescope.
