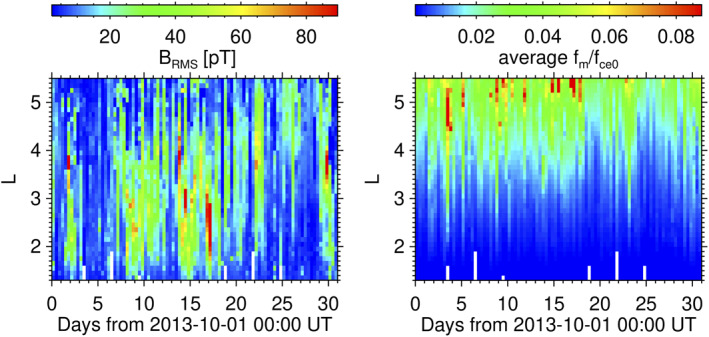
Figure 13.

Left: Characteristic magnetic field amplitude of whistler‐mode waves (in pT) derived from measurements of Van Allen Probes A in the 50–2,000 hertz band for October 2013. Right: logarithmic mean frequency of the whistler‐mode wave normalized by the electron gyrofrequency at the equator. Values ∼0.1 (e.g. on the 4th and 17th) show the 1–2 kHz band of chorus/exohiss waves.
