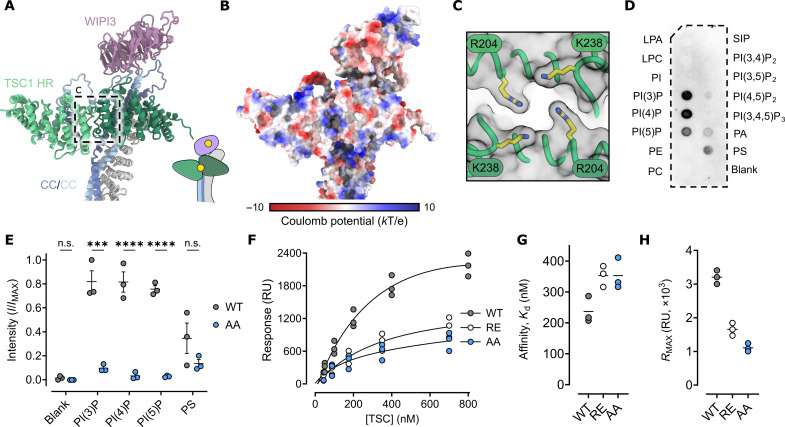
Fig. 3. The TSC1 HR dimer is a monophosphorylated PIP selective membrane association domain.
(A) Cartoon rendering of the TSC N-terminal PIP-binding domain and the WIPI3:TSC interaction. Inset: Illustration of the PIP binding sites of WIPI3 and the TSC1 HR dimer. (B) Surface rendering colored by coulomb potential. Several positively charged regions are presented on the surface. (C) The symmetrical arrangement of conserved lysine and arginine residues define an electro-positive recessed pocket. (D) Immunoblot of full length TSC probed against phosphatidylinositol lipid membrane strips illustrating specificity for monophosphorylated phosphatidylinositols. LPA, lysophosphatidic acid; LPC, lysophosphatidylcholine; PI, phosphatidylinositol; PE, phosphatidylethanolamine; PC, phosphatidylcholine; PA, phosphatidic acid; PS, phosphatidylserine; SIP, sphingosine-1-phosphate. (E) Densitometry analysis of replicate phosphatidylinositol lipid membrane strips. WT, wild type. AA, TSC K238A, R204A. Symbols show values from independent experimental replicates, the bold line shows the mean, and error bars show SEM; n.s., not significant; P values were determined using ordinary one-way analysis of variance (ANOVA) with Šidák’s multiple comparisons test (***P < 0.0002 and ****P < 0.0001). (F) Steady-state binding of TSC to 5% molar PI(3)P lipid bilayer (L1 chip) with 1,2-dioleoyl-sn-glycero-3-phosphocholine:1,2-dioleoyl-sn-glycero-3-phosphoethanolamine. Symbols show values from independent experimental replicates. RU, response units. (G) Stead-state affinity measurement of wild-type TSC (one-to-one binding model, solid line) estimates an apparent dissociation constant (Kd) of 237 nM, compared to 353 nM for both TSC K238A, R204A (AA) and TSC R204E (RE). (H) Plateau values of maximal response, RMAX, corresponding to model fit (F). Symbols show values from independent biological replicates, and the bold line shows the mean.

