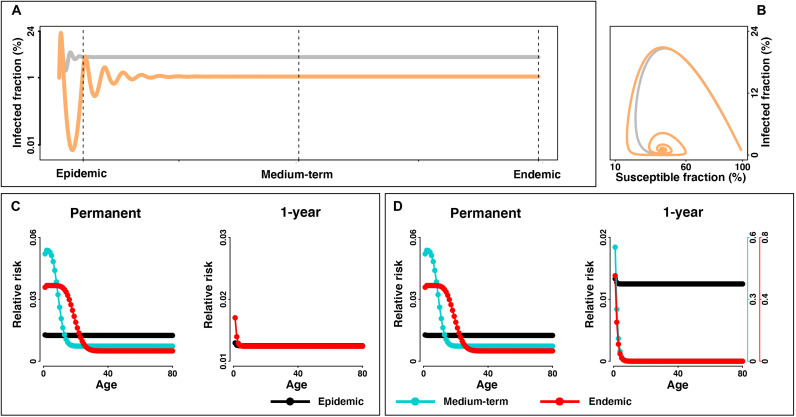
Fig. 1. Trajectory of infected fraction and transitions in age structure of the risk from virgin epidemic to endemic equilibrium.
(A) Infected fraction for an outbreak is simulated with R0 = 2.3, 1/γ = 7 days, and a short-lived (i.e., 3 months) (gray) and 1-year (orange) immunity duration over 20 years. The SIRS model is parameterized with rectangular demographic structure and homogeneous social mixing pattern. Dashed lines indicate different stages of disease dynamics. For visualization, only trajectories in scenarios of short-lasting (i.e., short-lived and 1 year) are presented. (B) Infected versus susceptible fraction. If primary and nonprimary infections have similar illness, (C) shows relative risk (i.e., age-specific infected fraction relative to the population-wide fraction) among age groups in the virgin epidemic, medium-term, and endemic stage under the scenario of permanent and 1-year immunity duration, respectively. If nonprimary infections are less severe, (D) shows relative risk from primary infections. Relative risk among age groups under the scenario of permanent, 10-year, 1-year, and short-lived immunity durations is shown in the Supplementary Materials (see fig. S1).

