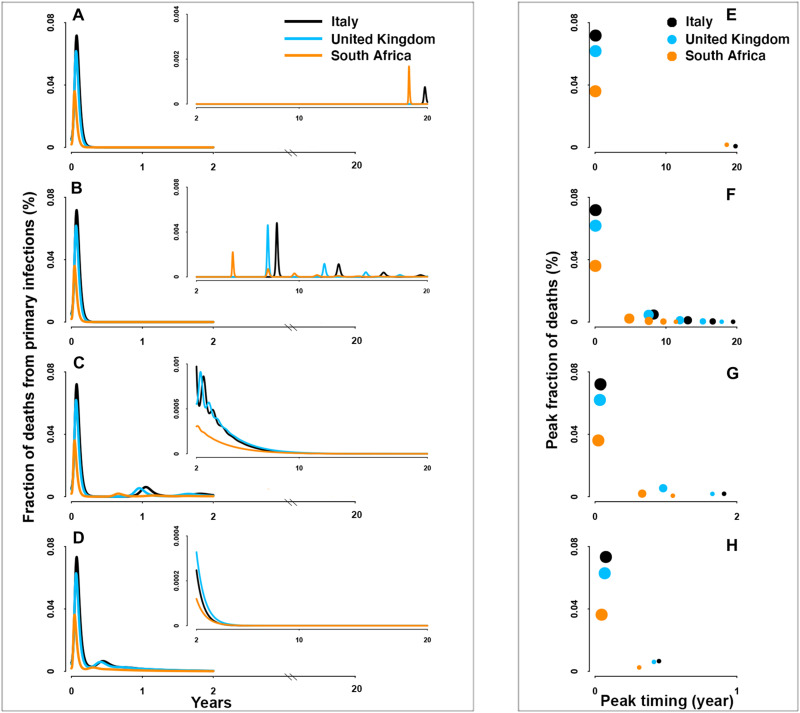
Fig. 3. Fraction of deaths from primary infections.
(A to D) Overall fraction of deaths over 20 years and (E to H) the timing and magnitude of consecutive peaks in the scenario of permanent, 10-year, 1-year, and short-lived (i.e., 3-month) immunity durations, respectively. Countries with different demographies and social mixing patterns are distinguished by color: Italy (black), United Kingdom (blue), and South Africa (orange). For visualization, insets show trajectories following the first 2 years.

