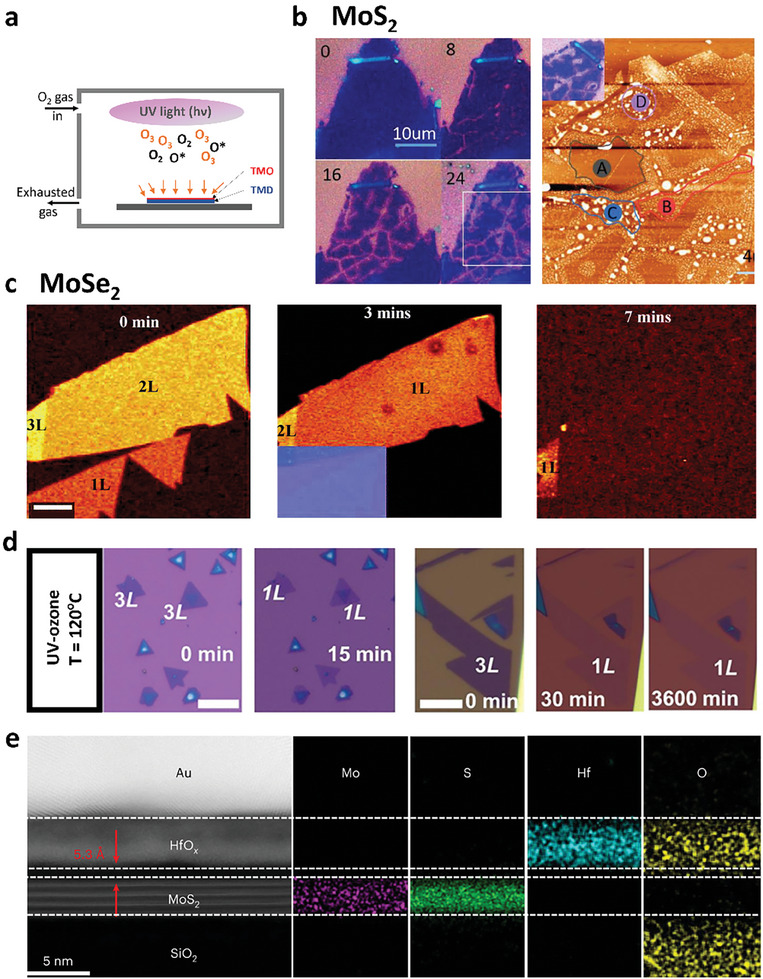
Figure 4.

a) Schematic of oxidation process for TMDs by UV‐ozone treatment. b) Optical images of 3L MoS2 with 0‐, 8‐, 12‐, and 24‐min treatments and AFM image after 24 min treatment. Reproduced under the terms of the CC‐BY‐NC‐ND 4.0 license.[ 84 ] Copyright 2020, The Authors, Published by Elsevier B.V. c) Raman mapping of MoSe2 upon sequent UV‐ozone treatments for 0, 3, and 7 min. Reproduced with permission.[ 85 ] Copyright 2019, Royal Society of Chemistry. d) Optical images of MoS2 flakes before and after UV‐ozone treatments. Reproduced with permission.[ 88 ] Copyright 2022, American Chemistry Society. e) Cross‐sectional TEM image of HfOx and MoS2 heterostructures and elemental distributions acquired by an EELS spectrometer. Reproduced with permission.[ 93 ] Copyright 2022, Springer Nature.
