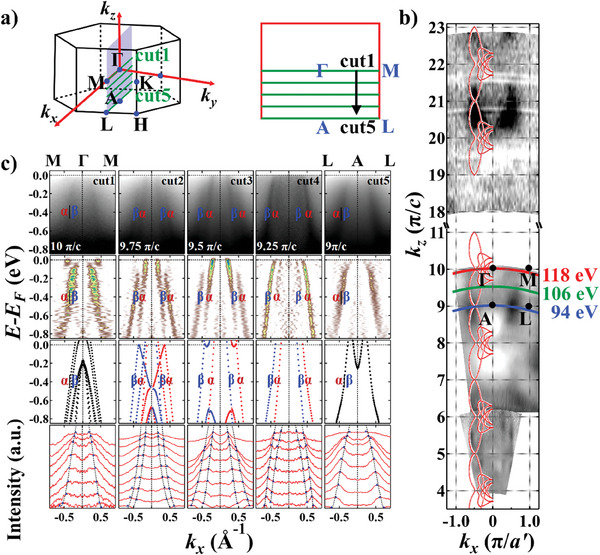
Figure 2.

Evolution of the band splitting at different out‐of‐plane momentum positions. a) 3D BZ of CrSb with a 2D cross‐section showing the ΓMLA plane. The green lines represent measurement positions for cuts 1–5. b) ARPES kz –kx CECs at binding energies E B = 0.6 eV, a′ = a. The inner potential was set to be V 0 = 12.8 eV. High symmetry points and kz –kx curves corresponding to three typical photon energies are labeled. The appended red curves represent the DFT calculational results. c) From top to bottom: ARPES band dispersion parallel to ‐ with an equal kz offset of 0.25 π/c between each; corresponding second derivative analysis along the EDCs; DFT‐calculated bulk bands (all calculated bands are shifted up by 0.15 eV to account for the charged defects in real crystals), where red and blue correspond to out‐of‐plane spin‐up and ‐down polarization, respectively; MDCs with peak fitting results. MDCs are drawn with an energy offset of 0.1 eV from E B = 0 eV to E B = 0.8 eV. Blue triangles denote the MDC peaks, and the black dashes represent the fitting curves.
