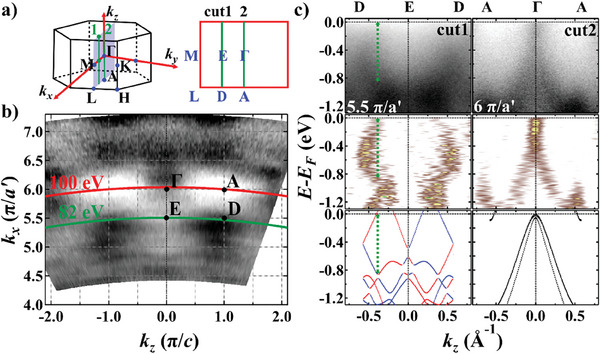
Figure 4.

Band splitting along non‐high‐symmetry momentum direction E–D. a) 3D BZ of CrSb with a 2D cross‐section showing the ΓMLA plane. Green lines represent the measurement directions of cuts 1–2 in Panel (c). b) ARPES CEC at E B = 0.6 eV. The inner potential was set as V 0 = 11.8 eV. High symmetry points and kx –kz curves correspond to two typical photon energies are labeled. c) From top to bottom: ARPES band dispersion along cuts 1–2 with incident hν = 82 eV (kz = 5.5 π/a′) and 100 eV (kz = 6 π/a′), respectively; corresponding second derivative analysis along the EDCs; DFT‐calculated bulk bands (all calculated bands are shifted up by 0.31 eV to account for the charged defects in real crystals), The green dashed line mark the biggest‐seen energy separation of the split bands (≈0.8 eV).
