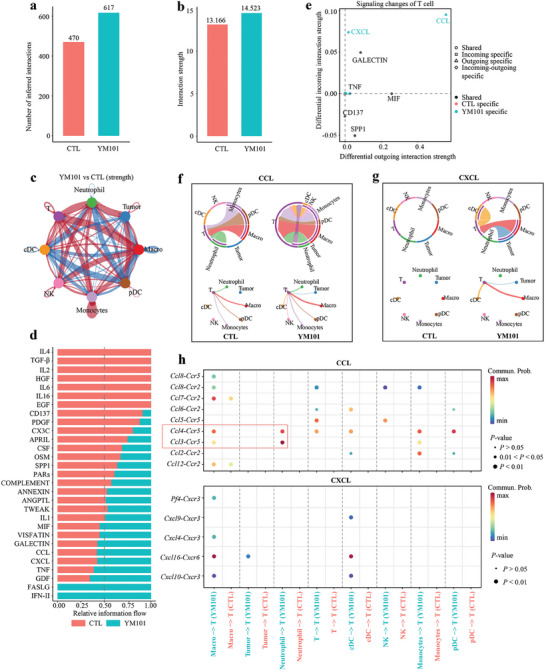
Figure 3.

Intercellular ligand‐receptor prediction among tumor‐infiltrating T cells and other cells revealed by CellChat package. a,b) Bar plots showing the number and strength of intercellular interactions in the CTL and YM101 groups. c) The size of the circles corresponds to the counts of different cell lineages, while the thickness of the edges signifies the intensity of interaction between these populations. The loops colored red were strengthened in the YM101 group, and these colored blue loops were strengthened in the CTL group. d) Differential incoming or outgoing signaling patterns of T cells in the CTL and YM101 groups. The bars colored red were the relative strength of the CTL group, and the colored blue bars were the relative strength of the YM101 group. e) Scatter plots presenting differential signaling patterns of T cells in CTL and YM101 groups. The signaling pathways colored red were specific in the CTL group, and these colored blue pathways were specific in the YM101 group. f) Chord diagrams and circle plots of the inferred CCL signaling flow targeting T cells. g) Chord diagrams and circle plots of the inferred CXCL signaling flow targeting T cells. h) Bubble plots depict potential ligand‐receptor pairs contributing to the enhanced CCL and CXCL signaling flows in the YM101 group. Dot color signifies communication probabilities, while dot size corresponds to calculated p‐values. The absence of dots indicates zero communication probability. The p‐values are calculated using a two‐sided permutation test.
