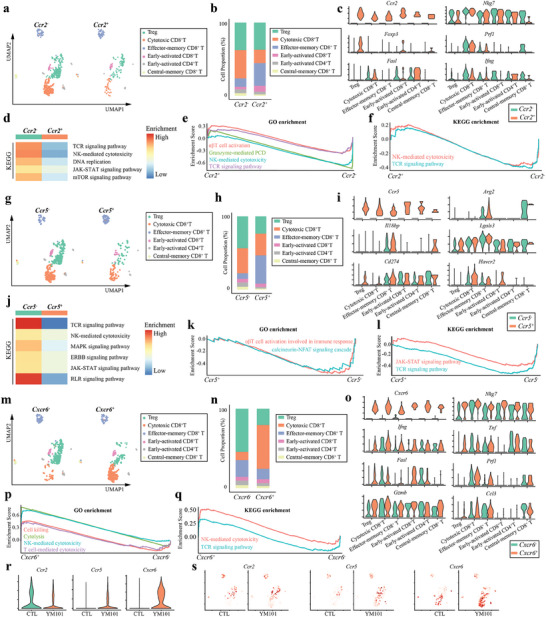
Figure 4.

The intrinsic features of Ccr2 +, Ccr5 +, and Cxcr6 + T cells of the YM101 group. a) Uniform manifold approximation and projection (UMAP) clustering for Ccr2 − and Ccr2 + T cells after YM101 treatment. In total 692 T cells, 495 were Ccr2 − (71.5%), and 197 were Ccr2 + (28.5%) T cells. b) Histogram representing the proportions of T‐cell subsets in the Ccr2− and Ccr2+ T cells of the YM101 group. c) Violin plots showing the expression levels of T cell activation‐associated markers. d) Heatmap showing enrichment analysis results of Ccr2− and Ccr2+ T cells of the YM101 group. e,f) GSEA enrichment plots showing the differences between Ccr2− and Ccr2+ T cells of the YM101 group. g) UMAP plot showing the results of reclustering analysis of T cells according to Ccr5 level. h) Histogram representing the proportions of T‐cell subsets in the Ccr5− and Ccr5+ T cells of the YM101 group. i) Violin plots showing the expression levels of immune suppression‐associated markers. j) Heatmap showing enrichment analysis results of Ccr5− and Ccr5+ T cells of the YM101 group. k,l) GSEA enrichment plots showing the differences between Ccr5− and Ccr5+ T cells of the YM101 group. m) UMAP plot showing the results of reclustering analysis of T cells according to Cxcr6 level. n) Histogram representing the proportions of T‐cell subsets in the Cxcr6− and Cxcr6+ T cells of the YM101 group. o) Violin plots showing the expression levels of T cell activation and cytotoxicity‐associated markers. p,q) GSEA enrichment plots showing the differences between Cxcr6− and Cxcr6+ T cells of the YM101 group. r) Violin plots showing the expression levels of Ccr2, Ccr5, and Cxcr6 in T cells of the CTL and YM101 groups. s) UMAP plots showing the expressions of Ccr2, Ccr5, and Cxcr6 in T cells of the CTL and YM101 groups.
