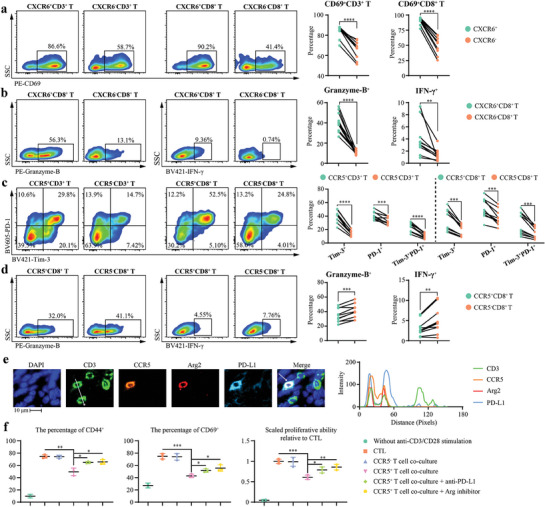
Figure 5.

The opposite functions of CXCR6+ and CCR5+ T cells. a–d) Representative images and quantitative analysis of CD69+CXCR6+ T cells, Granzyme‐B+CXCR6+CD8+ T cells, IFN‐γ+CXCR6+CD8+ T cells, Tim‐3+PD‐1+CCR5+ T cells, Granzyme‐B+CCR5+CD8+ T cells, and IFN‐γ+ CCR5+CD8+ T cells in flow cytometry assays (n = 10). e) Representative images and co‐localization analysis of immunofluorescent staining showing the expression of Arg2 and PD‐L1 in CCR5+ T cells. Immunofluorescent staining was performed on YM101‐treated EMT‐6 tumor samples. The histogram on the right represents the signal intensities along the white line indicated in the CD3 image. f) Flow cytometry assays to measure the influences of tumor‐infiltrating CCR5+ T cells on the activation of naïve T cells under the stimulation of anti‐CD3/CD28 (n = 2 for negative control without stimulation, n = 3 for others). Quantitative analyses of CFSE dilution, along with CFSE‐labeled CD69+ and CD44+ T cells, indicating T cell activation. Statistical analyses were performed using paired Student's t‐test (a–d) and Student's t‐test (f). Significance is indicated as: * p < 0.05, ** p < 0.01, *** p < 0.001, **** p < 0.0001.
