
Figure 1.
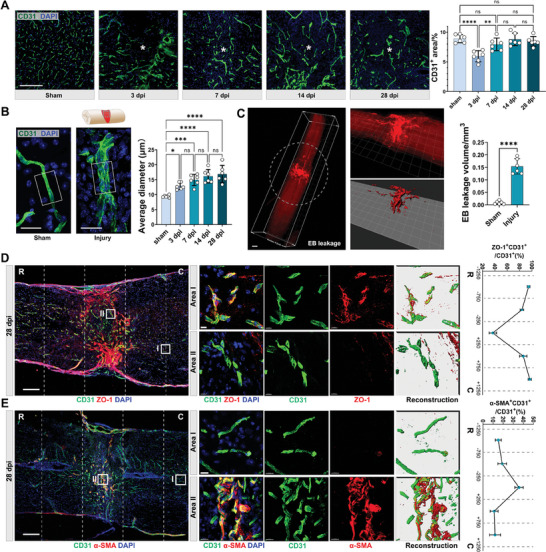
Pathological vascular remodeling in the chronic phase of SCI. A) Representative IF images of CD31 (green) and DAPI (blue), and quantitative analysis of CD31+ area (%) in the sham or epicenter of the injured spinal cord at 3, 7, 14, and 28 dpi. (Scale bar = 200 µm, * denotes epicenter, n = 6, mean ± SD, one‐way ANOVA, Tukey's multiple comparisons) B) Representative confocal images of CD31 (green) and DAPI (blue) in the sham or injured spinal cord (images captured from the epicenter as illustrated), and quantitative analysis of average diameters of CD31+ vessels in the sham or injured spinal cord at 3, 7, 14, and 28 dpi. (Scale bar = 20 µm, white box = 20 × 30 µm, n = 6, mean ± SD, one‐way ANOVA, Tukey's multiple comparisons) C) Light sheet‐microscope 3D images of the spinal cord after Evans blue (EB) leakage (red) assay (Scale bar = 500 µm). White dashed circles outline the epicenter. The quantification of the EB+ volume in spinal cord sections is presented (right). (n = 6, mean ± SD, unpaired t‐test) D) Representative confocal images of CD31 (green), ZO‐1 (red), and DAPI (blue) in the injured spinal cord at 28 dpi (n = 3, Scale bar = 200 µm, R rostral, C caudal), and the zoom‐in view of local vessels in Area I (injury epicenter) and Area II (uninjured area) (Scale bar = 10 µm). (Right panel: quantification of ZO‐1+CD31+/total CD31+ area (%), n = 3, mean ± SD, one‐way ANOVA, Tukey's multiple comparisons) E) Representative confocal images of CD31 (green), α‐SMA (red), and DAPI (blue) in the injured spinal cord at 28 dpi (n = 3, Scale bar = 200 µm), and the zoom‐in view of local vessels in Area I (injury epicenter) and Area II (uninjured area) (Scale bar = 15 µm). (Right panel: quantification of α‐SMA+CD31+/total CD31+ area (%) in spinal cord segments. (n = 3, mean ± SD, one‐way ANOVA, Tukey's multiple comparisons) ns not significant, ∗ p < 0.05, ∗∗ p < 0.01, ∗∗∗ p < 0.001, ∗∗∗∗ p < 0.0001.