
Figure 3.
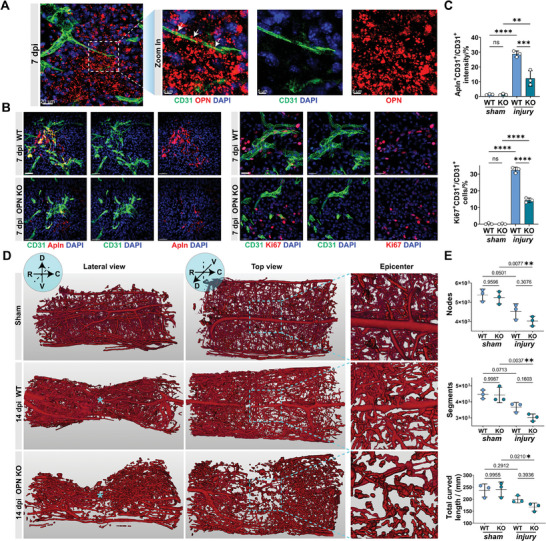
OPN KO mice exhibit impaired vascular regeneration after SCI. A) Representative confocal images and zoom‐in view of CD31 (green), OPN (red), and DAPI (blue) in the epicenter of injured spinal cord at 7 dpi. (Left scale bar = 20 µm, right scale bar = 5 µm) B) Representative confocal images of CD31 (green), Apln/Ki67 (red), and DAPI (blue) in the epicenter of injured spinal cord of WT and OPN KO mice at 7 dpi. (n = 3, Left scale bar = 40 µm, right scale bar = 20 µm) C) Quantitative analysis of Apln+CD31+/CD31+ fluorescence intensity (%) and Ki67+CD31+/CD31+ cells (%) in the sham group and injured spinal cord (7 dpi) of WT and OPN KO mice in (B). (n = 3, mean ± SD, one‐way ANOVA, Tukey's multiple comparisons) D) Representative 3D lateral and top views of Microfil‐perfused spinal cord microvasculature SRµCT data in the sham group and injured spinal cord (14 dpi) of WT and OPN KO mice. (n = 3, D dorsal, V ventral, R rostral, C caudal, * denotes epicenter) E) Quantitative analysis of spinal cord microvasculature in (D), including vasculature nodes, segments, and total curved length. (n = 3, mean ± SD, one‐way ANOVA, Tukey's multiple comparisons, p‐value indicated) ns not significant, ∗ p < 0.05, ∗∗ p < 0.01, ∗∗∗ p < 0.001, ∗∗∗∗ p < 0.0001.