
Figure 4.
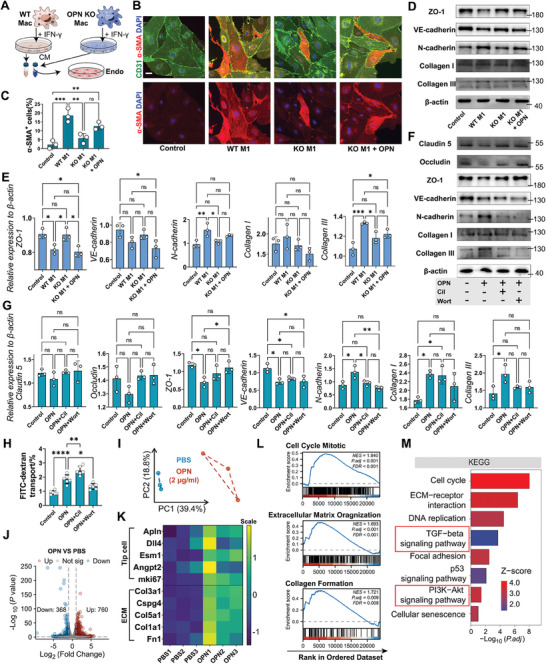
OPN promotes EndoMT and fibrosis of SCMECs in vitro. A) Experimental flowchart for treating SCMECs with Conditioned Medium (CM) from M1‐BMDMs of WT or OPN KO mice. B) Representative IF images of CD31 (green), α‐SMA (red), and DAPI (blue) in SCMECs treated with CM and recombinant OPN protein. (n = 3, Scale bar = 10 µm) C) Quantitative analysis of α‐SMA+ SCMECs proportions (%) in (B). (n = 3, mean ± SD, one‐way ANOVA, Tukey's multiple comparisons, ∗∗ p < 0.01, ∗∗∗ p < 0.001) D) Western blot images showing the protein expression levels of ZO‐1, VE‐cadherin, N‐cadherin, Collagen I, Collagen III, and β‐actin in SCMECs with different treatments of CM and recombinant OPN protein. E) Quantitative analysis of the relative protein expression level to β‐actin in (D). (n = 3, mean ± SD, one‐way ANOVA, Tukey's multiple comparisons) F) Western blot images showing the protein expression levels of Claudin5, Occludin, ZO‐1, VE‐cadherin, N‐cadherin, Collagen I, Collagen III, and β‐actin in SCMECs with different treatments of recombinant OPN protein, Cilengitide (Cil), and/or Wortmannin (Wort). G) Quantitative analysis of the relative protein expression level to β‐actin in (F). (n = 3, mean ± SD, one‐way ANOVA, Tukey's multiple comparisons) H) Quantitative analysis of FITC‐dextran transport rate (%) in the trans‐endothelial permeability assay. (n = 6, mean ± SD, one‐way ANOVA, Tukey's multiple comparisons) I) PCA plot showing the sample clusters in bulk RNA‐sequence. J) Volcano plot showing the number of DEGs after OPN treatment. K) Heatmap showing the scaled expression level of genes related to tip cell and ECM in DEGs. L) Gene set enrichment analysis (GSEA) visualization of pathways enriched in DEGs after OPN treatment. M) Histogram showing the ‐log10(p.adjust) and Z‐scores of terms enriched by the GO and KEGG analysis of DEGs. ns not significant, ∗ p < 0.05, ∗∗ p < 0.01, ∗∗∗ p < 0.001, ∗∗∗∗ p < 0.0001.