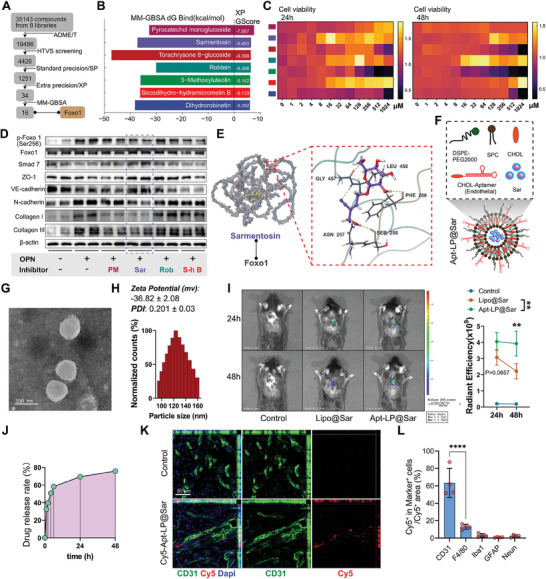
Figure 6.

Developing aptamer‐liposomes encapsulated small molecule targeting phosphorylation of Foxo1 in endothelial cells. A) Flowchart illustrating the molecular docking process for screening small‐molecule drugs targeting Foxo1. B) Histogram showing the top seven small‐molecule drugs ranked by MM‐GBSA dG Bind (kcal mol−1) and XP GScore. C) Heatmap showing the cell viability of SCMECs determined by CCK8 assay after treatment with different drugs for 24 h and 48 h. D) Western blot images showing the protein expression levels of p‐Foxo1 (Ser 256), Foxo1, Smad7, ZO‐1, VE‐cadherin, N‐cadherin, Collagen I, Collagen III, and β‐actin with different treatment of small‐molecule drugs. (n = 4) Quantitative analysis of the relative protein expression level is presented in Figure S8F (Supporting Information). E) Molecular schematic diagram of the interaction between Sarmentosin (Sar) and Foxo1 protein. Sar deeply penetrates into the binding pocket of Foxo1, establishing hydrophobic interactions with residues such as ALA455 and PRO456, and forming hydrogen bonds with residues GLY457, LEU458, PHE260, SER258, and ASN257 (wherein the murine Foxo1 protein's SER258 site corresponds to the human Foxo1 protein's phosphorylated SER256 site). F) Illustration of the assembly of Apt‐LP@Sar using DSPE‐PEG2000, soybean phosphatidylcholine (SPC), cholesterol molecules (CHOL), Aptamer‐CHOL, and Sar. G) Representative TEM images illustrating the morphology and dispersity of Aptamer‐liposome encapsulated sarmentosin (Apt‐LP@Sar). (Scale bar = 100 nm) H) Representative results of nanoparticle size and zeta potential analysis of Apt‐LP@Sar from the phase analysis light scattering (PALS) mode. I) Representative in vivo images and quantitative analysis of total radiant efficiency in the control and treatment groups at 24 h and 48 h after intravenous injection of saline, Dir‐labeled Lipo@Sar, and Dir‐labeled Apt‐LP@Sar. (color bar gradient: total radiant efficiency, n = 3, mean ± SD, two‐way ANOVA, Tukey's multiple comparisons) J) Drug release rate (%) of Apt‐LP@Sar within 48 hours determined by UV‐spectroscopy. K) Representative confocal images of in vivo tracing showing the co‐localization of Apt (Cy5, red)‐LP@Sar with endothelial cells (CD31, green) in the epicenter. (Scale bar = 50 µm, n = 4) L) Quantitative analysis of the proportion of the total Cy5 + Apt‐LP@Sar area in different cells (Figure S9C, Supporting Information). (n = 4, mean ± SD, one‐way ANOVA, Tukey's multiple comparisons) ∗∗ p < 0.01, ∗∗∗∗ p < 0.0001.
