
Figure 7.
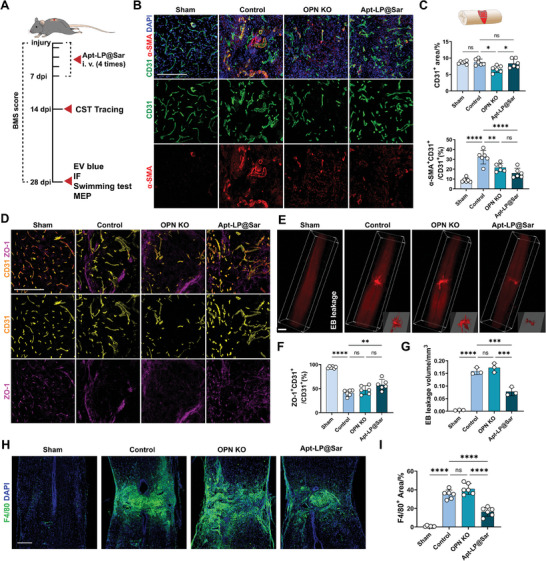
Apt‐LP@Sar alleviates pathological vascular remodeling and BSCB disruption after SCI. A) Illustration of the process of intravenous injection of the Apt‐LP@Sar and evaluation in mice after SCI. B) Representative IF images of CD31 (green), α‐SMA (red), and DAPI (blue) in the epicenter of the sham, control, OPN KO, and Apt‐LP@Sar‐treated spinal cord at 28 dpi. (Scale bar = 200 µm, n = 6) C) Quantitative analysis of epicenter CD31+ area (%) and α‐SMA+CD31+/ CD31+ area (%) in (B) (n = 6, mean ± SD, one‐way ANOVA, Tukey's multiple comparisons) D) Representative IF images of CD31 (yellow) and ZO‐1 (purple) in the epicenter of the sham, control, OPN KO, and Apt‐LP@Sar‐treated spinal cord at 28 dpi. (Scale bar = 200 µm, n = 6) E) Representative light sheet‐microscope 3D images of the spinal cord after EB leakage (red) experiment in the spinal cord of the sham, control, OPN KO, and Apt‐LP@Sar‐treated groups at 28 dpi. (Scale bar = 500 µm, n = 3) F) Quantitative analysis of ZO‐1+CD31+/ CD31+ area (%) in (D) (n = 6, mean ± SD, one‐way ANOVA, Tukey's multiple comparisons) G) Quantitative analysis of EB leakage volume in the spinal cord (%) in (E) (n = 3, mean ± SD, one‐way ANOVA, Tukey's multiple comparisons) H) Representative IF images of F4/80 (green) and DAPI (blue) in the spinal cord of the sham, control, OPN KO, and Apt‐LP@Sar‐treated groups at 28 dpi. (Scale bar = 200 µm, n = 6) I) Quantitative analysis of F4/80 + area (%) in the spinal cord. (n = 6, mean ± SD, one‐way ANOVA, Tukey's multiple comparisons) ns not significant, ∗ p < 0.05, ∗∗ p < 0.01, ∗∗∗ p < 0.001, ∗∗∗∗ p < 0.0001.