
Figure 8.
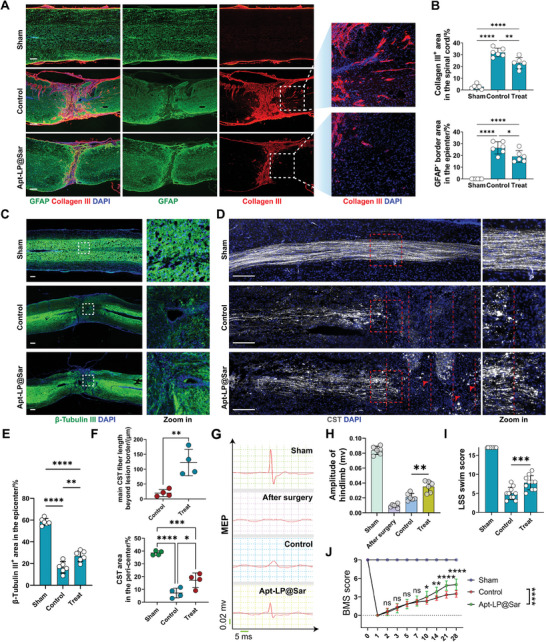
Apt‐LP@Sar promote axon regeneration and functional recovery in mice following SCI. A) Representative IF images of GFAP (green), Collagen III (red), and DAPI (blue) in the spinal cord of the sham, control, and Apt‐LP@Sar‐treated groups at 28 dpi. (Scale bar = 200 µm, n = 6). B) Quantitative analysis of Collagen III + area and GFAP− border area in the spinal cord (%) in (A). (n = 6, mean ± SD, one‐way ANOVA, Tukey's multiple comparisons) C) Representative IF images and local zoom‐in views of β‐Tubulin III (green) and DAPI (blue) in the spinal cord of the sham, control, and Apt‐LP@Sar‐treated groups at 28 dpi. (Scale bar = 200 µm, n = 6). D) Representative fluorescence images and local zoom‐in views of dextran‐labeled CST (white) and DAPI (blue) in the spinal cord of the sham, control, and Apt‐LP@Sar‐treated groups at 28 dpi. (Scale bar = 200 µm, Intervals of red dashed lines = 200 µm, n = 4) E) Quantitative analysis of β‐Tubulin III + area in the epicenter (%) in (C). (n = 6, mean ± SD, one‐way ANOVA, Tukey's multiple comparisons) F) Quantitative analysis of main CST fiber beyond lesion border and CST area in the peri‐center in (D). (n = 4, mean ± SD, unpaired t‐test, and one‐way ANOVA, Tukey's multiple comparisons) G) Representative images of hindlimb motor evoked potentials (MEPs) in the sham, after surgery, control, and Apt‐LP@Sar‐treated groups at 28 dpi. H) Quantification of the amplitude of hindlimb in (G) (n = 6, mean ± SD, one‐way ANOVA, Tukey's multiple comparisons). I) Quantification of the swimming test using the Louisville swim scale (LSS) swim score (n = 10, mean ± SD, one‐way ANOVA, Tukey's multiple comparisons). J) Basso mouse scale (BMS) scores over time post‐injury in the sham, control, and Apt‐LP@Sar‐treated groups. (n = 10, mean ± SD, two‐way ANOVA, Tukey's multiple comparisons) ns not significant, ∗ p < 0.05, ∗∗ p < 0.01, ∗∗∗ p < 0.001, ∗∗∗∗ p < 0.0001.