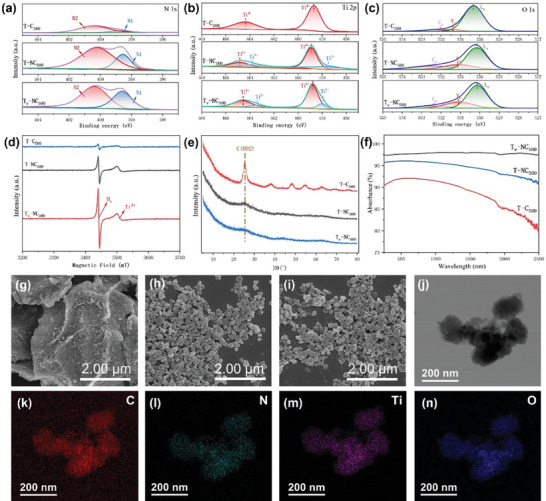
Figure 2.

a–c) XPS spectra of N, Ti, and O elements; d) EPR spectra; e) XRD patterns; and f) UV–vis‐NIR absorption spectra of the three photothermal materials. SEM images of g) T‐C500, h) T‐NC500, and i) Tv‐NC500. HRTEM images and elemental mapping of Tv‐NC500 (j–n).
