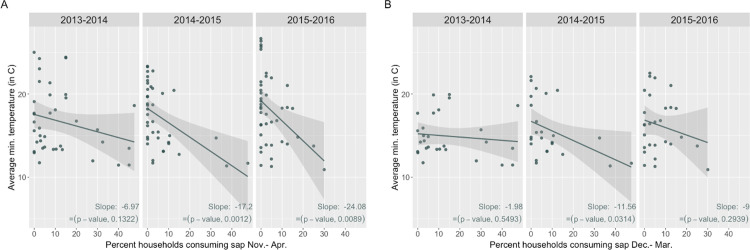
Fig 2. Sap consumption and minimum temperature by season.
(A) Monthly percentages of household sap consumption and monthly average of daily minimum temperatures by location over sap seasons, Nov.-Apr. (B) Monthly percentages of household sap consumption and monthly average of daily minimum temperatures by location over a subset of months within the sap season, Dec.-Mar.

