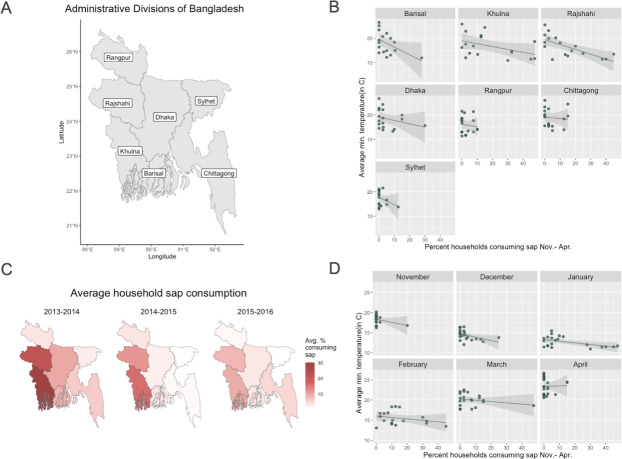
Fig 3. Sap consumption and minimum temperature by month and location.
(A) Map of administrative divisions of Bangladesh, (B) Monthly percentages of household sap consumption and monthly average of daily minimum temperatures by location over all sap seasons of the study period, Nov.-Apr. 2013–2016. (C) Average percentages of household sap consumption across sap seasons in each division and (D) Average percentages of household sap consumption and minimum temperatures in each division by month across all sap seasons.

