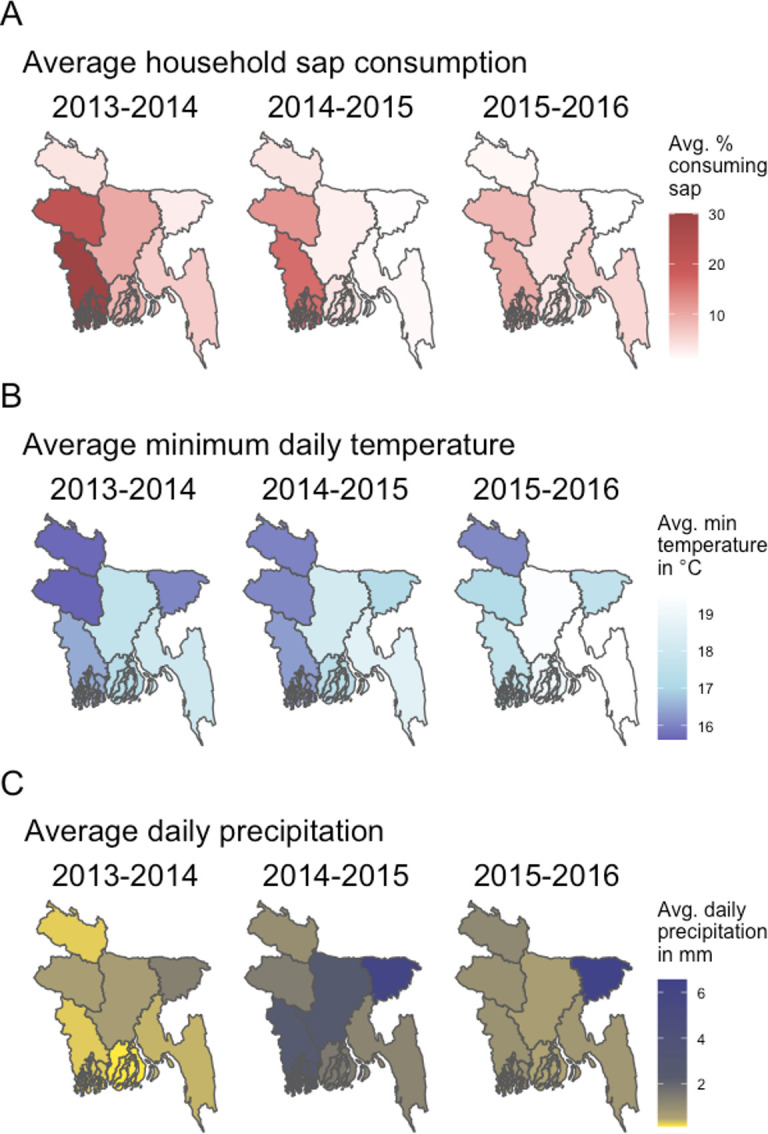
Fig 4. Sap consumption and weather by location and season.

Relationship between date palm sap consumption and weather in Bangladesh, November-April, 2013–2016. (A) Average percentages of household sap consumption over sap seasons by division (B) Average of all daily minimum temperatures in°C over sap seasons by division (C) Average of all daily values of cumulative precipitation in millimeters over sap seasons by division.
