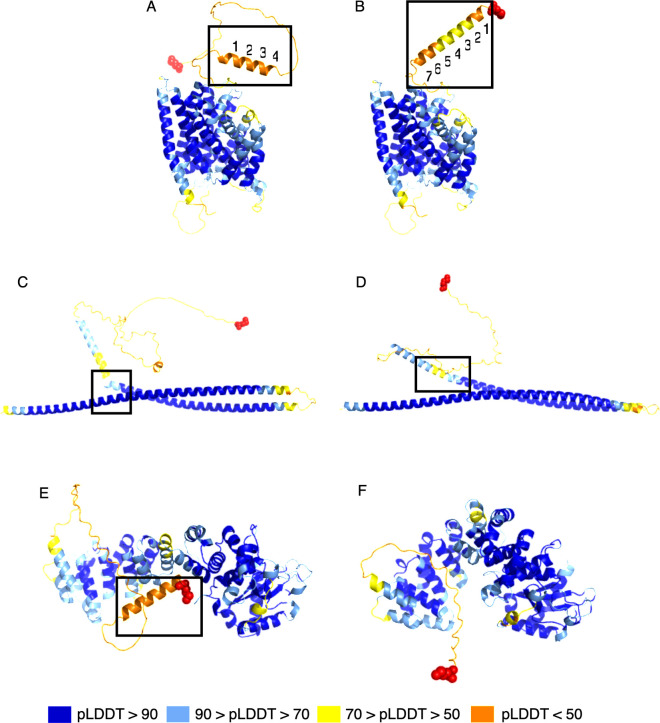
Fig 5. Examples of structure changes in novel protein variants identified in this study.
(A) and (B): alpha helix elongation at the SLC28A1 gene locus, where (A) shows the reference protein, ENST00000398637.10, and (B) shows the novel isoform, uorft_2119. The average pLDDT increase from A to B was 2.96. (C) and (D): straightening at the TRAK2 gene locus, where (C) shows the native protein, ENST00000430254.1, and (D) shows the novel isoform, uorft_441. The average pLDDT increase from C to D was 3.41. (E) and (F): tightening of a structure of TBRG4, where (E) shows the known protein, ENST00000395655.8, and (F) shows the novel isoform, uorft_1435. The main structural changes are highlighted by black boxes for each pair of structures. Red spheres represent the N-terminus of each protein. The average pLDDT increase from E to F was 4.29.

