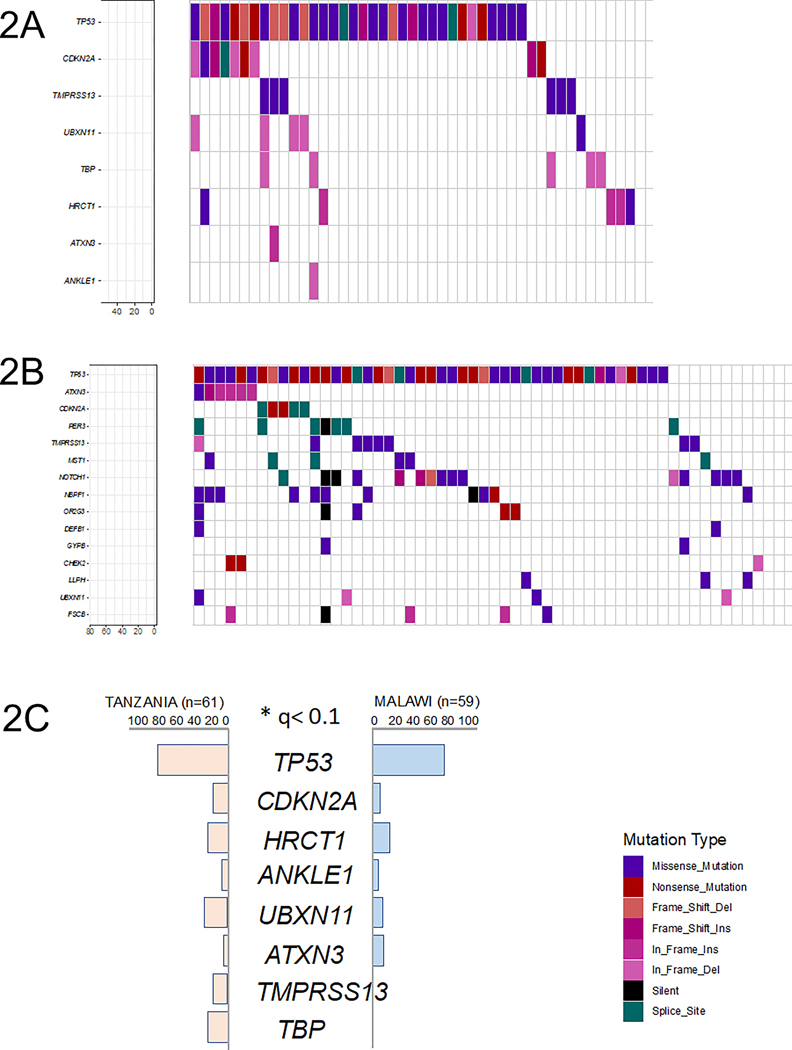
Figure 2. Summary of recurrently mutated genes.
Each column represents one patient sample, and columns are ordered according to gene mutation frequency. The overall frequencies of synonymous and non-synonymous mutations are summarized at the top of the figure. Percentage of the cohort harboring a mutation(s) in a given gene is depicted at the bottom left of each figure.
(2A) Somatic point mutations in the Tanzania cohort (n=61).
(2B) Somatic point mutations in the Malawi cohort (n=59).
(2C) Significantly mutated genes in the Tanzania and Malawi cohorts.

