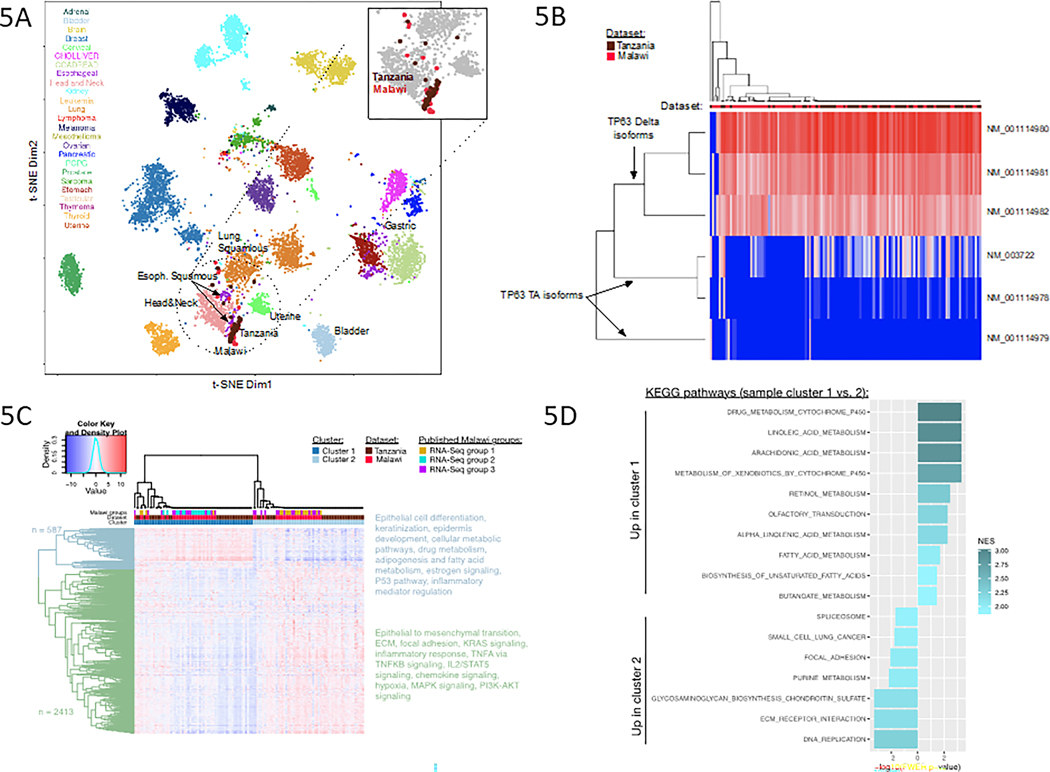
Figure 5. Transcriptomic analysis of esophageal squamous cell carcinoma from Tanzania and Malawi.
(5A.) t-SNE projection of pan-cancer RNA-Seq data, showing that both the Tanzania and Malawi datasets cluster with other squamous tumors from a combined cohort of clinical and TCGA.
(5B.) Heatmap of expression levels of six different TP63 isoforms, three Delta and three TA, in which columns represent individual samples in Tanzania and Malawi datasets and rows represent individual isoforms.
(5C.) Final clustering solution (k=2), based on expression of the 3,000 most varying genes across combined Tanzania and Malawi datasets.
(5D.) KEGG pathways from Gene Set Enrichment Analysis results for cluster 1 versus cluster 2 contrast, based on whole transcriptome.

