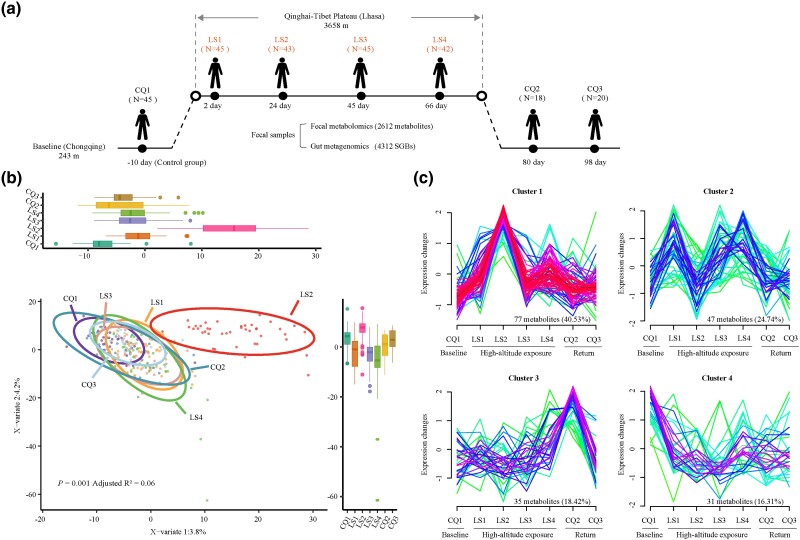
Fig. 1.
Study design and fecal metabolite dynamics during high-altitude hypoxia. a) Diagrammatic representation of the study design, illustrating exposure to high-altitude hypoxia and the ensuing comprehensive longitudinal analysis of fecal metabolomics and metagenomics. b) PLS-DA score plot of 2311 identified fecal metabolites from 260 samples. Each point denotes an individual sample, with color coding reflecting different time points, and coordinates values for each sample at each time point depicted in boxplots. c) Cluster analysis of 190 significant fecal metabolites (fold change > 1, VIP > 1, FDR < 0.2), illustrating their temporal patterns associated with hypoxic exposure.

