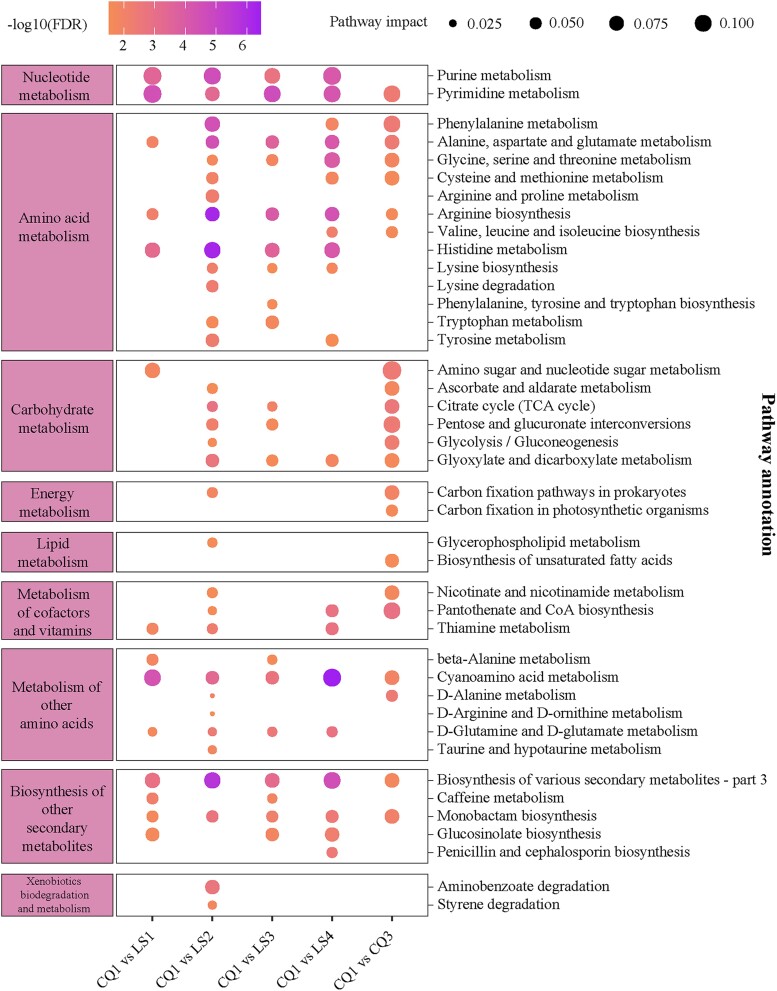
Fig. 2.
KEGG pathway-based functional profiling of fecal metabolites. A bubble plot illustrates the significantly enriched KEGG pathways at various time points. The CQ2 time point is omitted due to the absence of significant pathway enrichment compared to the baseline. The left and right panels categorize the pathways according to KEGG metabolic categories: Levels B and C, respectively. In the central panel, bubble colors indicate the significance of enrichment relative to the baseline, while bubble sizes reflect the proportion of metabolites associated with each pathway. Enrichment significance (FDR) is calculated using Fisher's exact test (see “Materials and Methods”).

