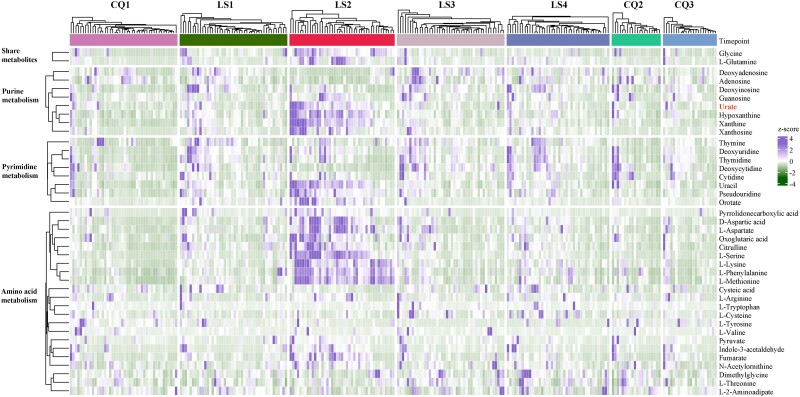
Fig. 3.
Core metabolites dynamics under high-altitude hypoxia. This heatmap illustrates the longitudinal trajectory of key metabolites implicated in purine, pyrimidine, and amino acid metabolism, which are pivotal for high-altitude adaptation in humans. The left panel categorizes the pathways (Level B) enriched by these 40 notable metabolites. In the central panel, each grid corresponds to the relative abundance of a specific metabolite within a given sample, with the grid color denoting the z-score of the metabolite's relative abundance. On the right-hand panel, there corresponds a name for each metabolite. For additional insights, refer to supplementary figs. S2 and S3 and table S7, Supplementary Material online.

