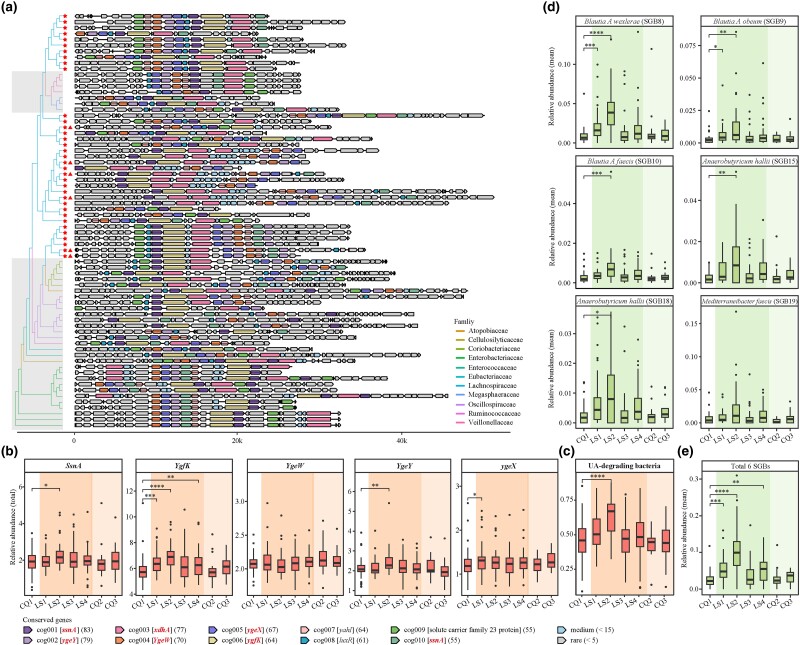
Fig. 4.
Characteristics of UA gene cluster. a) The phylogenetic landscape of the UA gene cluster is depicted, with asterisks denoting SGBs from the Lachnospiraceae family and triangles highlighting the six indicator species in d). The shaded gray region delineates families distinct from Lachnospiraceae. See also supplementary table S4, Supplementary Material online. The term “cog” symbolizes the cluster orthogroup, with gene symbol IDs encased in square brackets. IDs highlighted in bold italic font signify UA-inducible genes validated by prior studies (Kasahara et al. 2023; Liu, Xu, et al. 2023; Liu, Jarman, et al. 2023), while the remaining IDs pertain to genes identified in our present study. Numbers in parentheses indicate the frequency of each gene within its respective cluster orthogroup. b) The total relative abundance of five UA-inducible genes in each sample, based on 1,079 SGBs. UA-inducible genes are styled in italicized text. Each point corresponds to an individual sample, with color gradients reflecting distinct exposure stages. c) The total abundance changes of UA-degrading bacteria in each sample. Here, “UA-degrading bacteria” refers to bacteria that harbor all five UA-inducible genes. d, e) The dynamic shifts in the relative abundance of the six indicator SGBs at the LS2 time point and their cumulative relative abundances, respectively. Statistical significance is denoted as follows: *P < 0.05, **P < 0.01, and ***P < 0.001 by Wilcoxon rank-sum test.

