. 2024 Nov 20;13:RP94347. doi: 10.7554/eLife.94347

Figure 8. Zika virus (ZIKV) infection does not significantly impact the association of IGF2BP2 with IGF2BP1, IGF2BP3, and YBX1.

Huh7.5 cells stably expressing IGF2BP2-HA (+) and control cells (-) were infected with ZIKV H/PF/2013 at an MOI of 10, or left uninfected. Two days later, cell extracts were prepared and subjected to anti-HA immunoprecipitations. (A) Purified complexes were analyzed by western blotting for their content in the indicated proteins. IGF2BP1 (B), IGF2BP3 (C), and YBX1 (D) levels were quantified and means of protein signals (normalized to actin [extracts] and IGF2BP2 [IP]) ± SEM are shown based on six to eight independent experiments. ns: not significant (unpaired t-test).

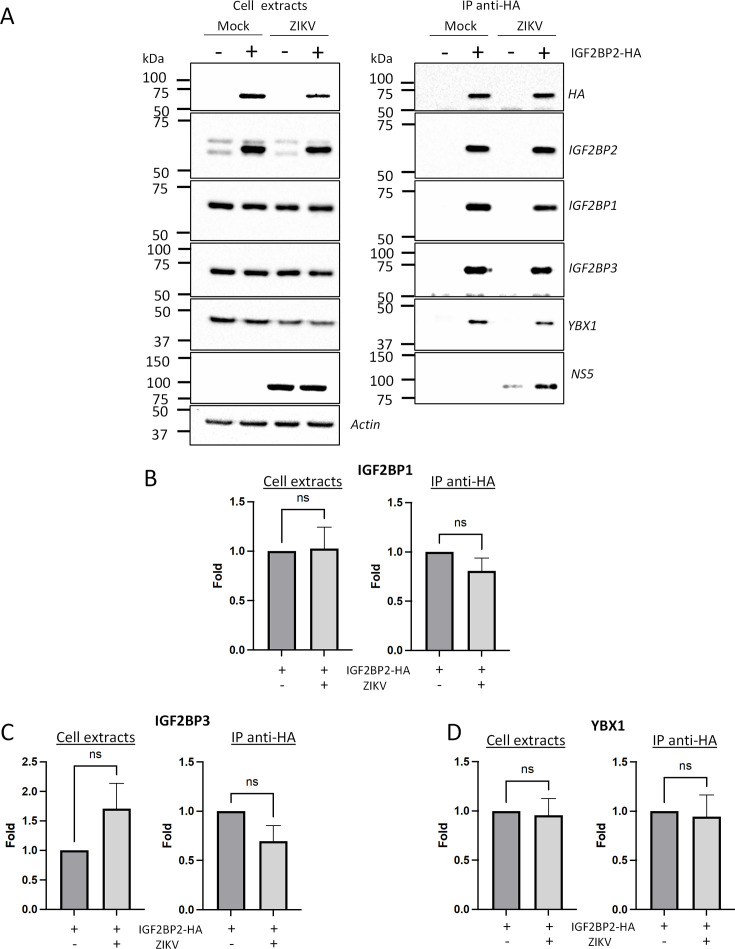
Figure 8—source data 1. Data points to generate the bar graphs of Figure 7B–D.
Figure 8—source data 2. PDF file containing original western blots for Figure 8A, indicating the relevant bands and conditions.
Figure 8—source data 3. Original files for western blot analysis displayed in Figure 8A.

Figure 8.

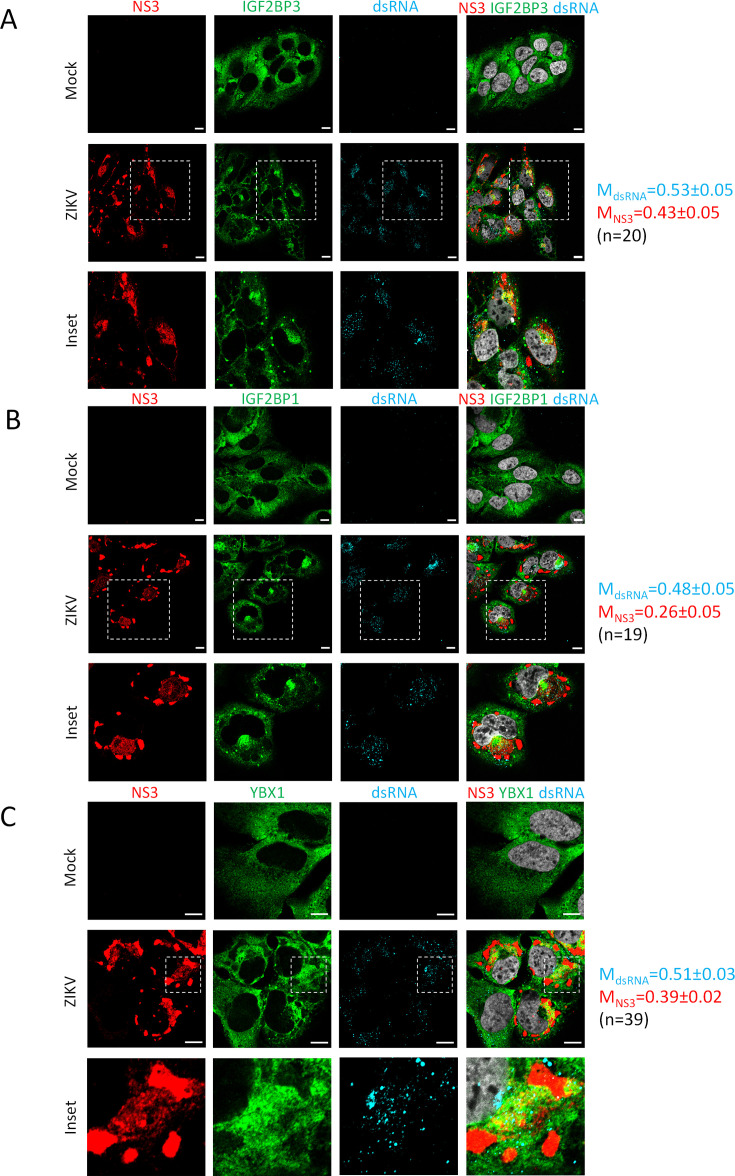
Figure 8—figure supplement 1. IGF2BP1, IGF2BP3, and YBX1 relocalize to the viral replication compartment in Zika virus (ZIKV)-infected cells.

Figure 8—figure supplement 1.

Huh7.5 cells were infected with ZIKV H/PF/2013 with an MOI of 10 or left uninfected. Two days post-infection, cells were fixed, immunolabeled for the indicated factors, and imaged by confocal microscopy. Scale bar = 10 µm. The Manders’ coefficients (mean ± SEM) representing the fraction of dsRNA (cyan) and NS3 (red) signals overlapping with IGF2BP3 (A), IGF2BP1 (B), or YBX1 (C) signals are shown (n=number of cells). The white squares indicate the magnified areas in the insets.
Figure 8—figure supplement 1—source data 1. Data points to determine the mean Manders’ coefficients.
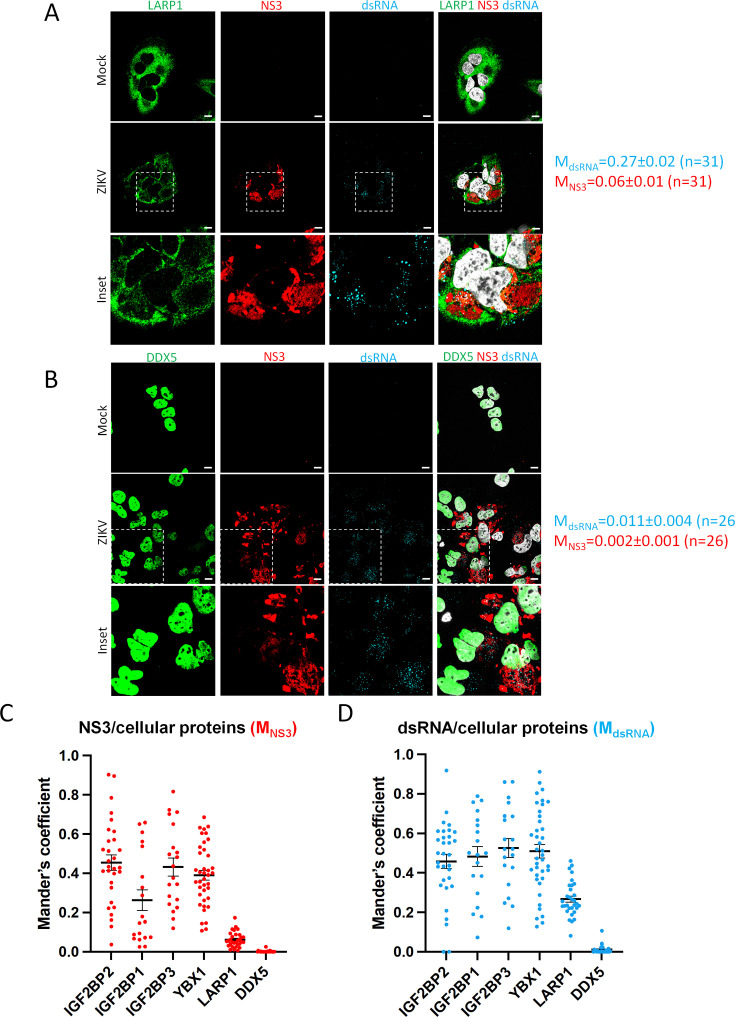
Figure 8—figure supplement 2. LARP1 and DDX5 do not relocalize to the viral replication compartment in Zika virus (ZIKV)-infected cells.

Figure 8—figure supplement 2.

(A–B) Huh7.5 cells were infected with ZIKV H/PF/2013 with an MOI of 10 or left uninfected. Two days post-infection, cells were fixed, immunolabeled for the indicated factors, and imaged by confocal microscopy. Scale bar = 10 µm. The Manders’ coefficients (mean ± SEM) representing the fraction of double-stranded RNA (dsRNA) (cyan) and NS3 (red) signals overlapping with LARP1 (A) or DDX5 (B) signals are shown (n=number of cells). The white squares indicate the magnified areas in the insets. (C–D) The Manders’ coefficients per cell determined from Figure 4B, Figure 8—figure supplements 1A–C and 2A, B are plotted. Means ± SEM are shown in black.
Figure 8—figure supplement 2—source data 1. Data points to determine the mean Manders’ coefficients.
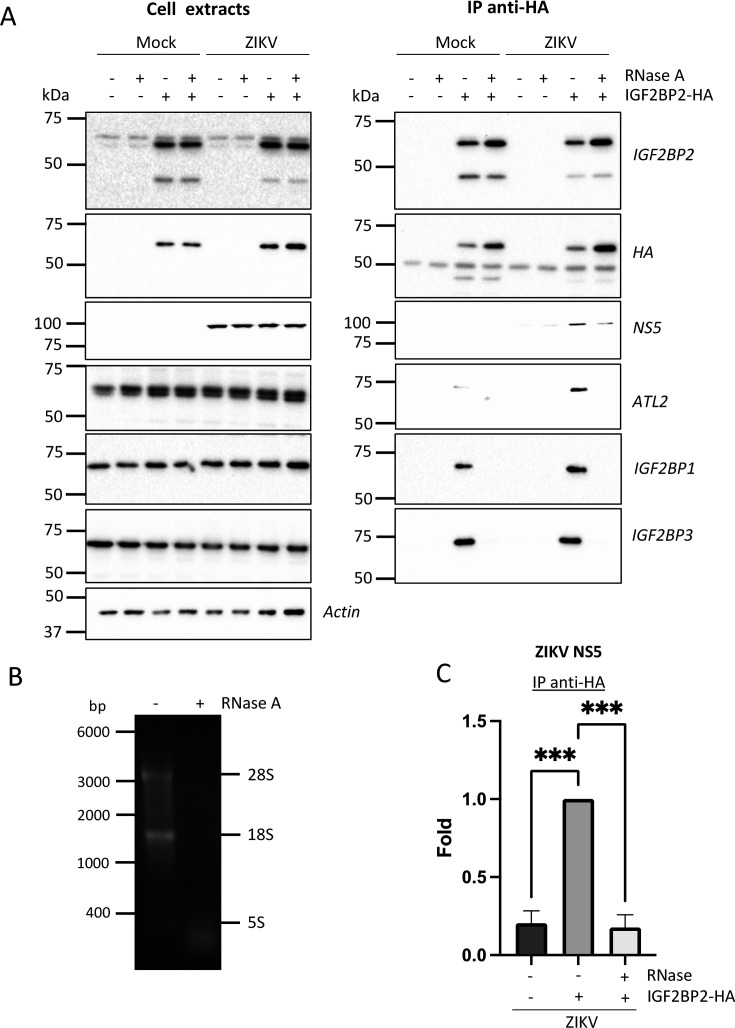
Figure 8—figure supplement 3. The association between IGF2BP2 and Zika virus (ZIKV) NS5 is RNA-dependent in infected cells.

Figure 8—figure supplement 3.

(A) Huh7.5 cells stably expressing IGF2BP2-HA (+) and control cells (-) were infected with ZIKV H/PF/2013 at an MOI of 10 or left uninfected. Two days later, cell extracts were prepared and subjected to RNase A treatment (+) or not (-) before anti-HA immunoprecipitations. The resulting complexes were analyzed by western blotting for their abundance in the indicated proteins. (B) The RNA content in cell extracts was analyzed on an agarose gel for controlling the efficiency of the RNase A treatment. (C) ZIKV NS5 levels in the IP samples were quantified and means of protein signals (normalized to IGF2BP2) ± SEM based on three independent experiments are shown. ***: p<0.001 (unpaired t-test).
Figure 8—figure supplement 3—source data 1. Data points to generate the bar graphs in Figure 8—figure supplement 3C .
Figure 8—figure supplement 3—source data 2. PDF file containing original western blots for panel A, indicating the relevant bands and conditions.
Figure 8—figure supplement 3—source data 3. Original files for western blot analysis displayed in panel A.