. 2024 Nov 20;13:RP94347. doi: 10.7554/eLife.94347

Figure 9. Zika virus (ZIKV) infection alters the IGF2BP2 proteo-interactome.

Huh7.5 cells expressing IGF2BP2-HA and control cells were infected with ZIKV H/PF/2013, dengue virus serotype 2 (DENV2) 16681s, or left uninfected. Two days later, cell extracts were prepared and subjected to anti-HA immunoprecipitations. Resulting complexes were analyzed by quantitative mass spectrometry. (A) Venn diagram depicting the overlap between IGF2BP2 partners modulated by ZIKV and/or DENV infections. (B) Gene ontology (GO) biological process analyses of the IGF2BP2 interactions which were impacted upon ZIKV infection. (C) Interaction tree of the 62 IGF2BP2 interactions modulated by ZIKV infection (generated with STRING online resource). The red and green circles identify the partners of the STRING network whose association with IGF2BP2 is decreased and increased during infection, respectively. The biological process analysis generated by STRING is also shown.

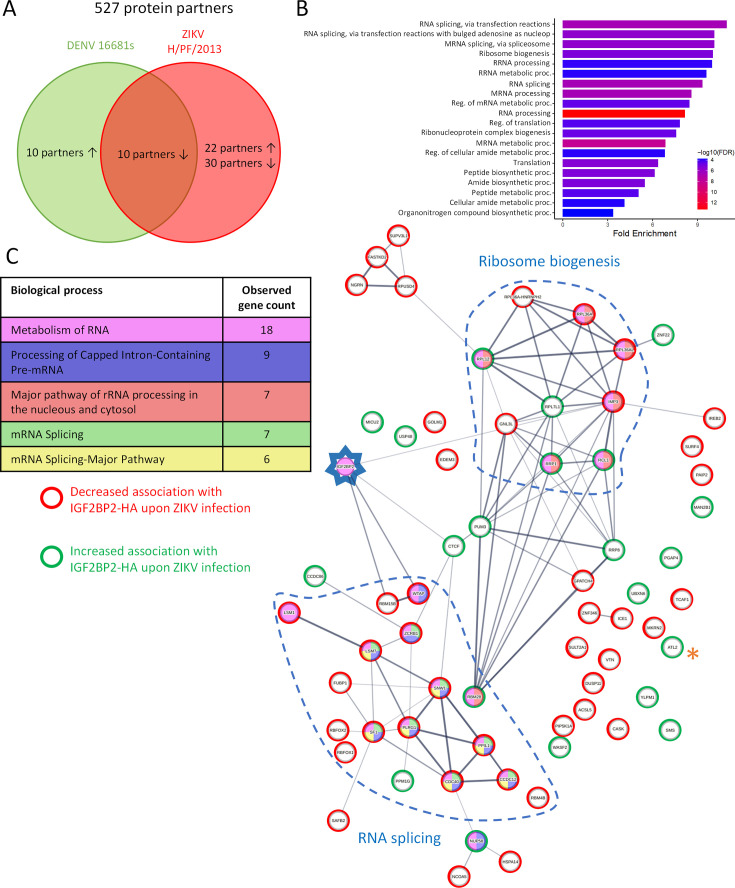
Figure 9.

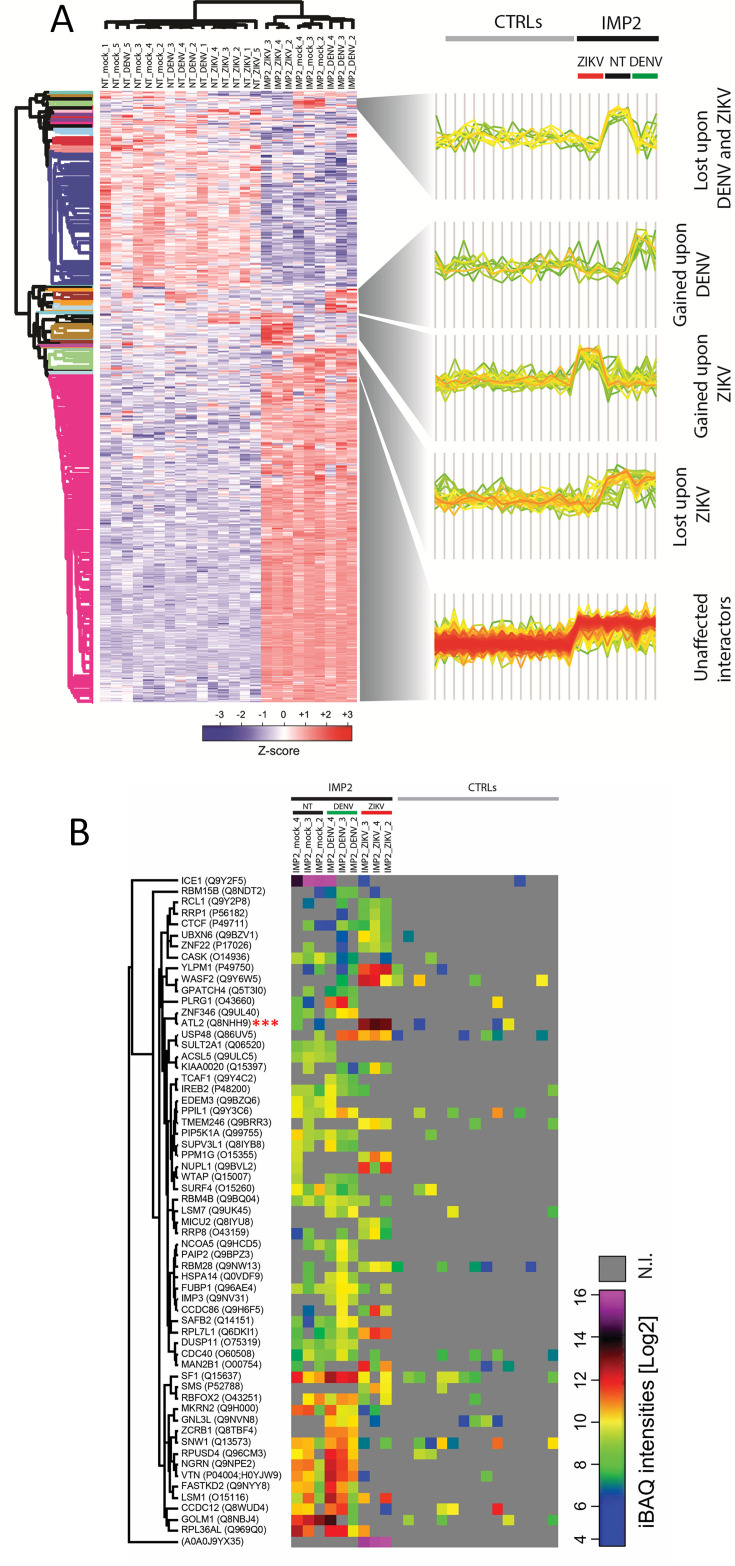
Figure 9—figure supplement 1. Orthoflavivirus infection modulates the interactome of IGF2BP2.

Figure 9—figure supplement 1.

(A) Heatmap of z-scored protein intensities of all significantly regulated interacting proteins (ANOVA, false discovery rate [FDR] < 0.05) across stimuli (mock, dengue virus [DENV]-infected, Zika virus [ZIKV]-infected) and baits (nontarget [NT], IGFBP2). (B) Intensity-based absolute quantification (iBAQs) of protein abundance of differential interacting proteins of IGF2BP2 upon DENV or ZIKV infection (N.I.=not identified).
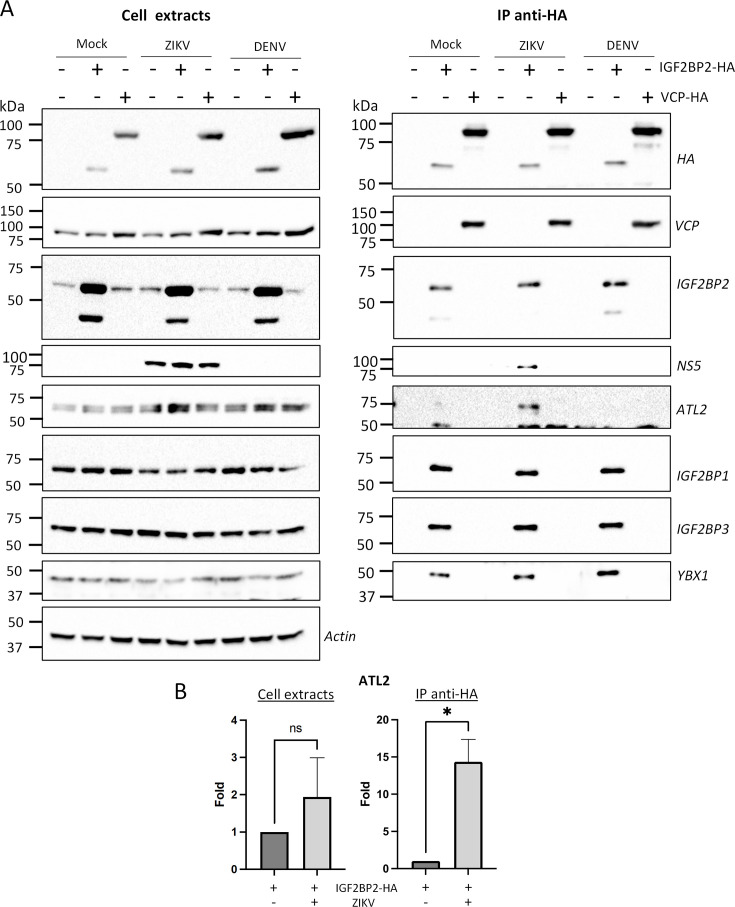
Figure 9—figure supplement 2. Zika virus (ZIKV) infection enhances the interaction between IGF2BP2 and ATL2.

Figure 9—figure supplement 2.

(A) Huh7.5 cells expressing IGF2BP2-HA and control cells were infected with ZIKV H/PF/2013 at an MOI of 10 or left uninfected. Two days later, cell extracts were prepared and subjected to anti-HA immunoprecipitations. The resulting complexes were analyzed by western blotting for their abundance in the indicated proteins. (B) ATL2 levels were quantified and means of protein signals (normalized to actin [extracts] and IGF2BP2 [IP]) ± SEM are shown. *: p<0.05; ns: not significant (unpaired t-test).
Figure 9—figure supplement 2—source data 1. Data points to generate the bar graphs in Figure 9—figure supplement 2B.
Figure 9—figure supplement 2—source data 2. PDF file containing original western blots for panel A, indicating the relevant bands and conditions.
Figure 9—figure supplement 2—source data 3. Original files for western blot analysis displayed in panel A.