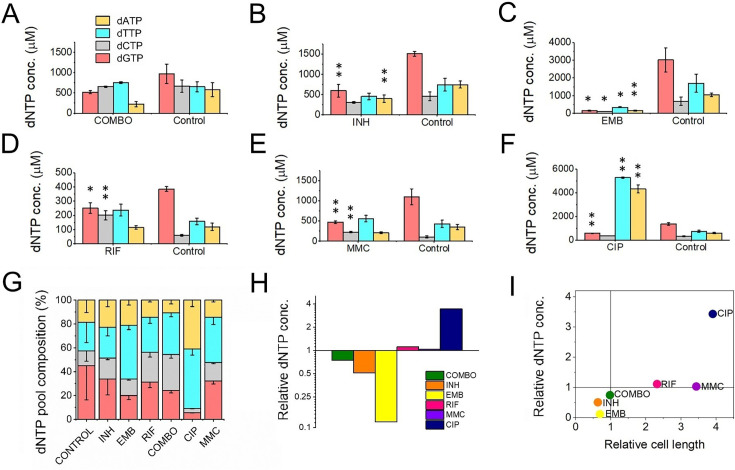
Figure 4. First-line antituberculotic treatments and DNA damaging agents alter dNTP concentrations in the cell.
(A–F) Cellular dNTP concentrations in drug-treated M. smegmatis. dNTP levels were measured in cellular extracts and normalized to the average cell volume for each treatment, yielding the concentrations shown. Each drug treatment and dNTP quantification included a corresponding control to account for potential fluctuations in growth and experimental conditions. Note the different scales on the y-axis. Data bars represent the averages of three biological replicates each carried out in three technical replicates; error bars represent SE. The p-values from the t-tests calculated for the measured differences are provided in Figure 1—source data 1, with significance indicated in the figure by asterisks as follows (**) for p<0.04 and (*) for p<0.07. (G) dNTP pool compositions of drug-treated bacteria. The large error bars in the control data arise from the combination of individual controls measured for each treatment. (H) Summed molar concentration of all four dNTPs compared to the control for each treatment. The y-axis is on a log2 scale to equally represent both increases and decreases. (I) Correlation of relative cell size (determined from cell lengths, compared to control cells) to relative total dNTP concentration for each treatment.

