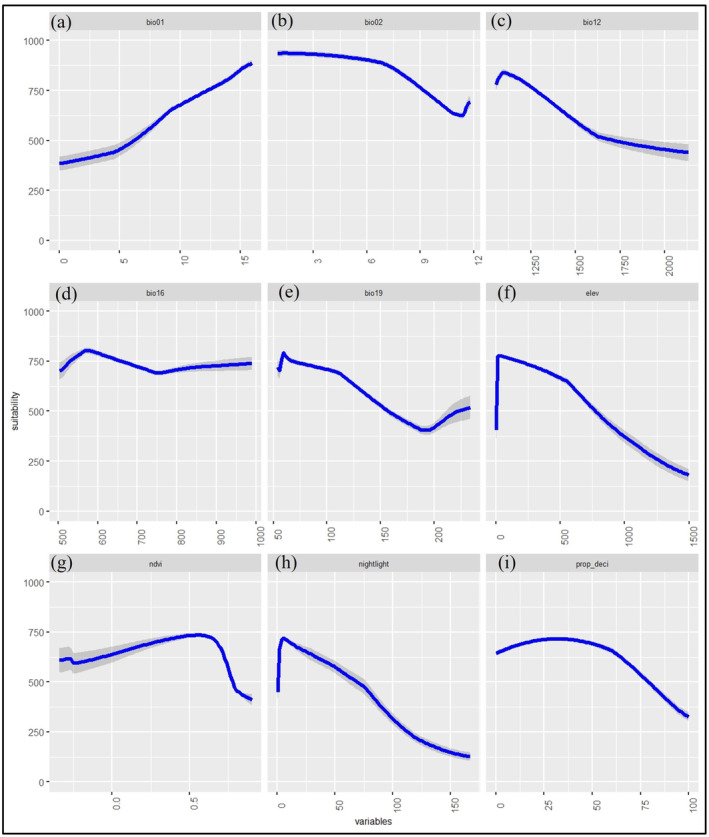
FIGURE 2.

Response curves for the analyzed variables: (a) bio01: Annual mean temperature, (b) Bio02: Mean diurnal range, (c) Bio12: Annual precipitation, (d) Bio16: Precipitation of wettest Quarter, (e) Bio19: Precipitation of coldest quarter, (f) elev: Elevation, (g) ndvi: Normalized difference vegetation index, (h) nightlight: Nighttime Light, and (i) prop_deci: Proportion of deciduous forest. These curves project the distribution of brown rat (BR) using the Maximum Entropy (MaXEnT) model in South Korea.
