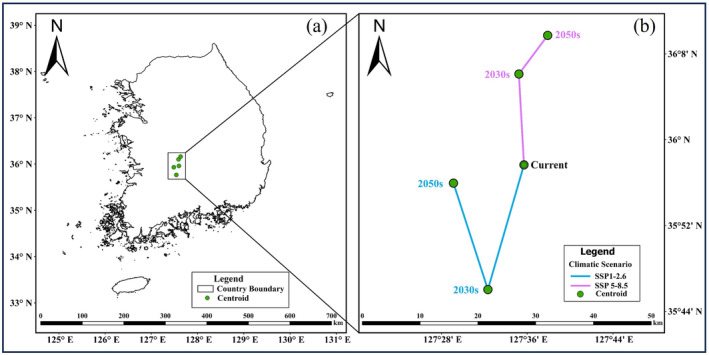
FIGURE 5.

Centroid shift in the potential distribution of brown rat (BR) during the 2030s and 2050s under SPP 1–2.6 and SSP 5–8.5. (a) Centroids, and (b) The green point indicates the centroid of the distribution whereas the line indicates the direction and magnitude of the centroid shift from current to 2030s, and from 2030s to 2050s under SSP 1–2.6 and SSP 5–8.5.
