
Figure 5.
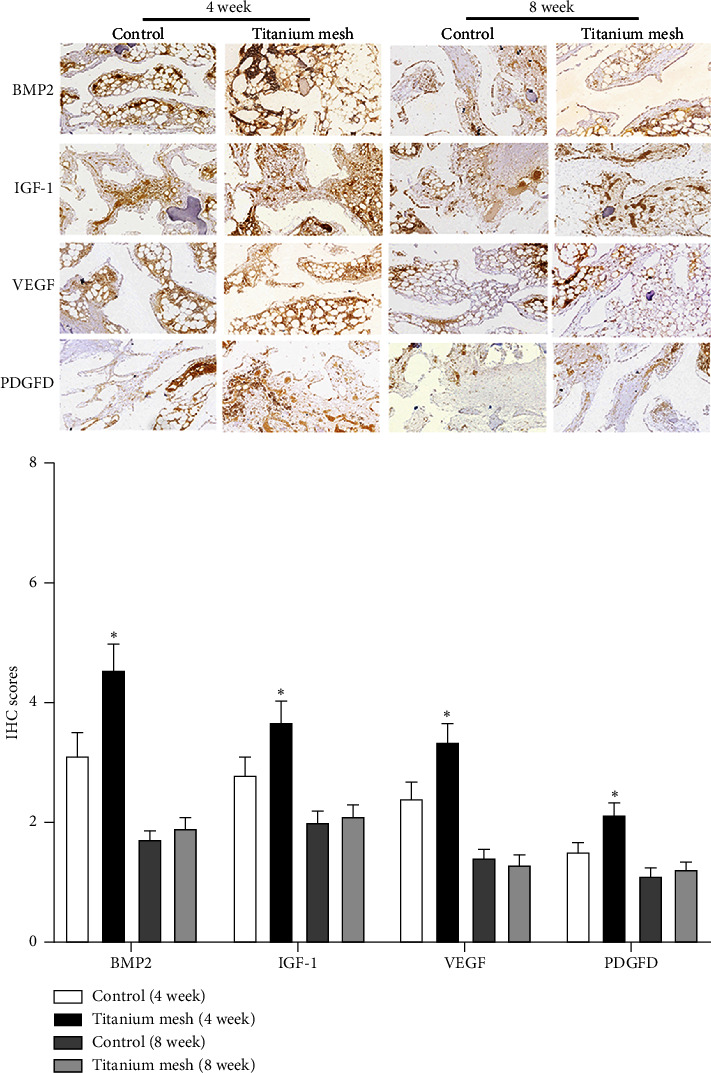
Expression of BMP2, VEGF, IGF-1, and PDGFD in sheep rib tissue detected by the IHC method (100×). Data represented as mean ± SD, n = 3. ∗p < 0.05 compared with the control group.
Official websites use .gov
A
.gov website belongs to an official
government organization in the United States.
Secure .gov websites use HTTPS
A lock (
) or https:// means you've safely
connected to the .gov website. Share sensitive
information only on official, secure websites.
Expression of BMP2, VEGF, IGF-1, and PDGFD in sheep rib tissue detected by the IHC method (100×). Data represented as mean ± SD, n = 3. ∗p < 0.05 compared with the control group.