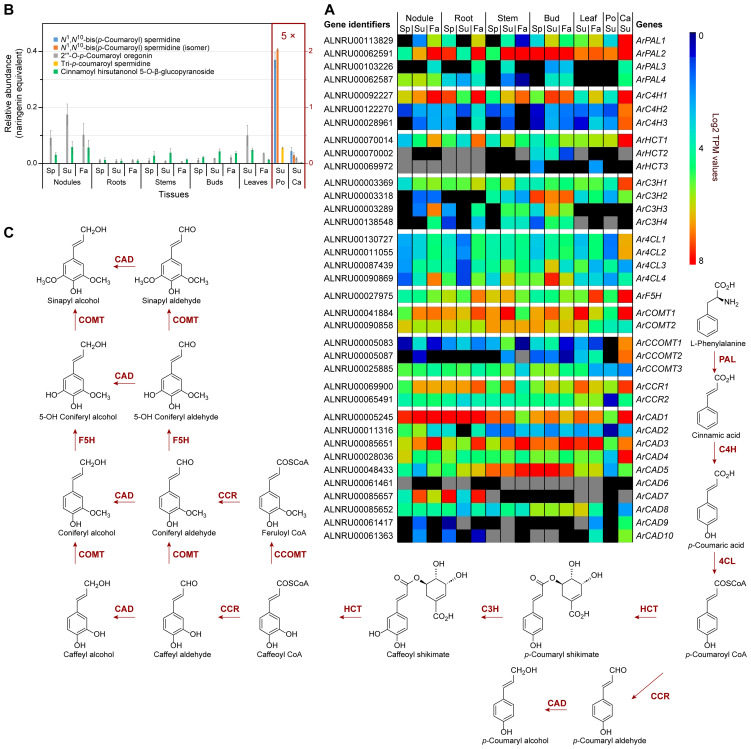
Figure 3.
Phenylpropanoid pathway and related metabolites. (A) Heatmap showing average Log2 TPM (transcripts per million) values obtained from transcriptomics analysis for putative phenylpropanoid pathway genes. Grey shading indicates that there were no reads detected. (B) Relative phenylpropanoid metabolite abundances in naringenin equivalents. (C) Simplified phenylpropanoid pathway to monolignols. Ca, catkins; Fa, fall; Po, pollen; Sp, spring; Su, summer. See Supplementary Table S4 for gene abbreviations.

