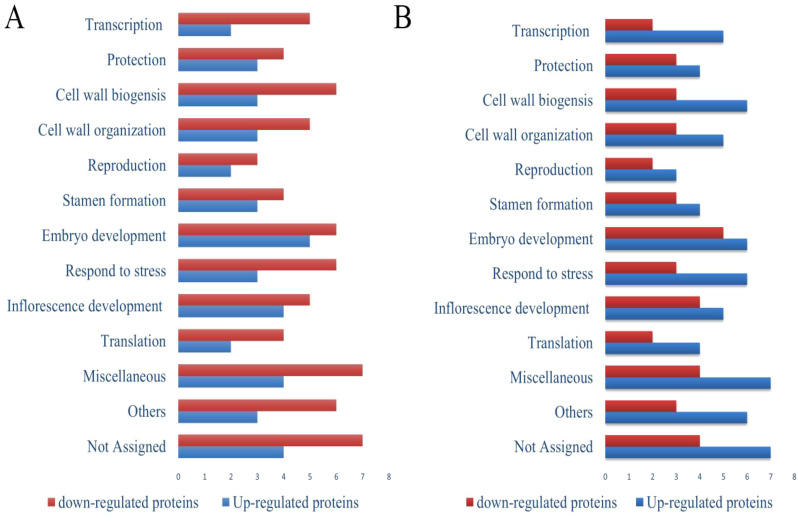
Figure 5.
Functional categorization of proteins in seeds of ‘Kinnow’ plants up- and down-regulated compared to healthy controls (T0). (A) untreated disease plants (T1), and (B) diseased plants treated with 75 mg L–1 of SeNPs (T5). The full list of proteins with significant abundance changes (p<0.05) is given in Supplementary Table 3 . Blue and red columns mean up-regulated and down-regulated proteins, respectively.

