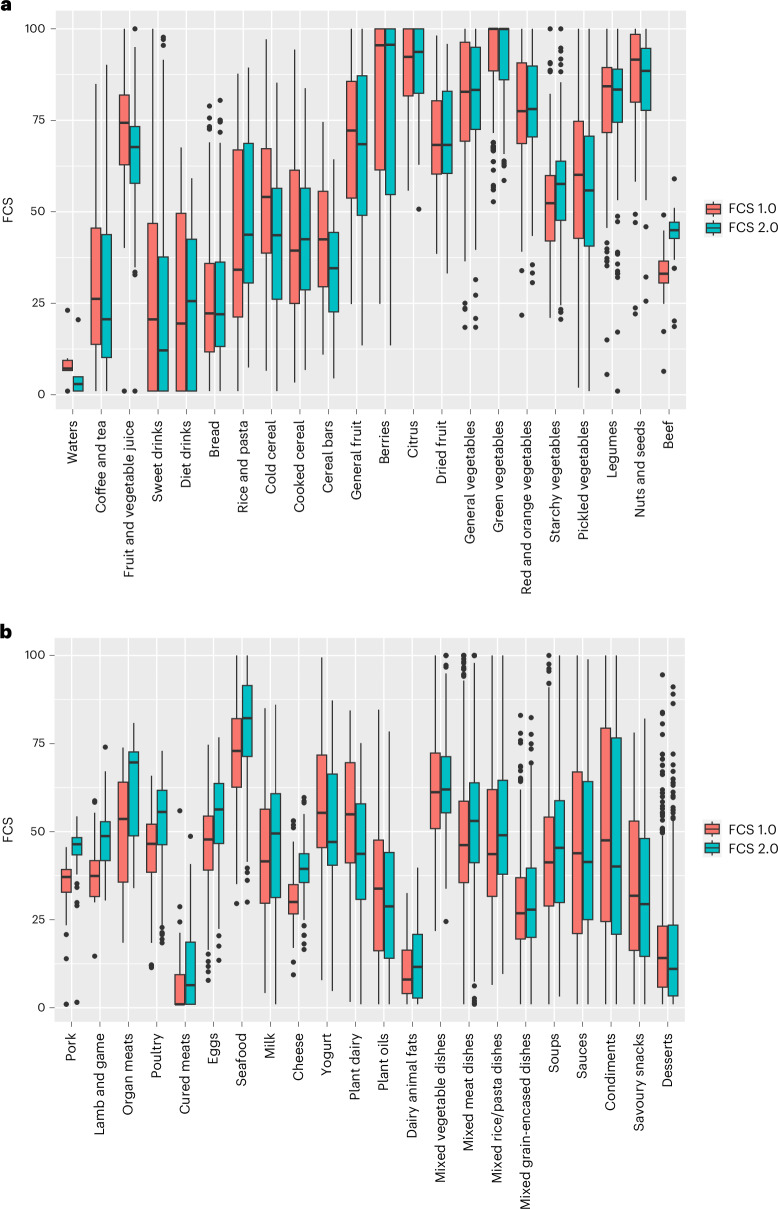
Fig. 1. Updated and original FCSs for products consumed by US adults.
a,b, Data are from 9,273 products reported within NHANES 2001/02–2017/18 for subcategories 1–22 (a) and 23–44 (b). Standard box plots are shown, with horizontal lines representing the median value, bounds of boxes representing the 25th (lower bound) and 75th (upper bound) percentile values, whiskers representing 1.5 × interquartile range from the 25th percentile (for the lower whisker) and the 75th percentile (for the upper whisker), and the black dots beyond these bounds representing outliers.

