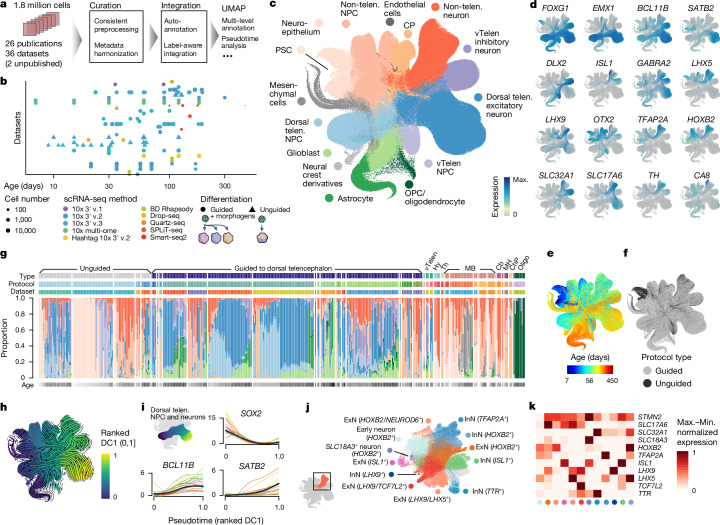
Fig. 1. Integrated HNOCA.
a, Overview of HNOCA construction pipeline. b, Metadata of biological samples included in HNOCA. c–f, UMAP of the integrated HNOCA, coloured by level 2 cell type annotations (c), gene expression profiles of selected markers (d), sample ages (e) and differentiation protocol types (f). g, Proportions of cells assigned to different cell types in the HNOCA. Every stacked bar represents one biological sample, grouped by datasets and ordered by increasing sample ages. Top bars show 36 datasets, organoid differentiation protocols, protocol types. Bottom bars show the sample age. h, UMAP of the integrated HNOCA coloured by top-ranked diffusion component (DC1) on the real-time-informed transition matrix between cells. The stream arrows visualize the inferred flow of cell states toward more mature cells. i, Marker gene expression profiles along cortical pseudotime. j, UMAP of non-telencephalic neurons, coloured and labelled by clusters. k, Heatmap showing relative expression of selected genes across different non-telencephalic neuron clusters. Coloured dots show cluster identities as shown in j. Cb, cerebellum; ChP, choroid plexus; CP, choroid plexus; Hy, hypothalamus; max., maximum; MB, midbrain; MH, medulla; min., minimum; Oligo, oligodendrocyte; OPC, oligodendrocyte progenitor cell; PSC, pluripotent stem cell; telen., telencephalon; Th, thalamus; vTelen, ventral telencephalon.

