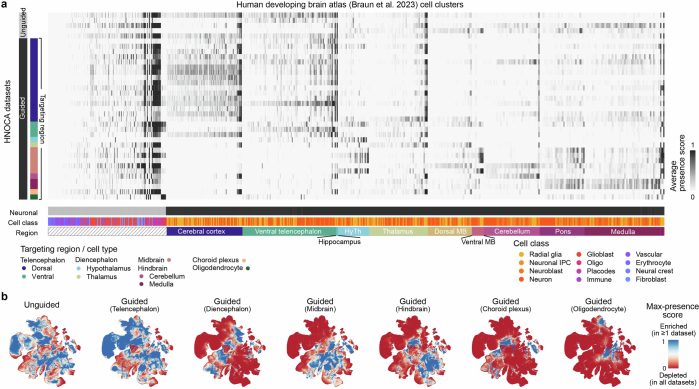
Extended Data Fig. 5. Presence scores per HNOCA data set.
(a) Average normalized presence scores of different HNOCA data sets (rows) in different cell clusters in the primary reference of the human developing brain atlas27 (columns). Sidebars on the left show organoid differentiation protocol types of HNOCA data sets. Sidebars underneath show cell class and the commonest region information of the cell clusters in the primary reference (HyTh - hypothalamus, MB - midbrain). (b) UMAP of the primary reference, colored by the max presence scores across different HNOCA data subsets, split by organoid protocol types. A high max presence score suggests enrichment of the corresponding primary cell state in at least one HNOCA data set among the data sets based on the specific type of organoid protocols, with a low score meaning under-representation of the cell state in all data sets in the subset.

