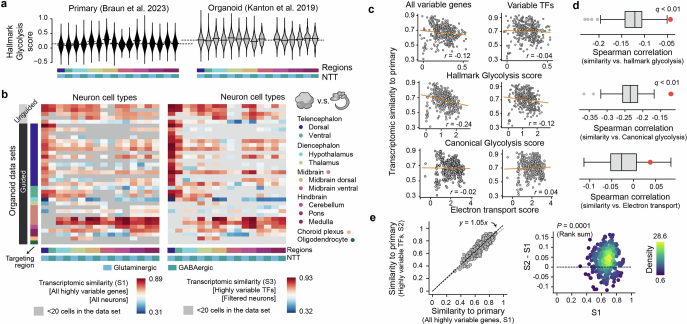
Extended Data Fig. 7. Transcriptomic fidelity of neurons and cell stress.
(a) Hallmark glycolysis scores of different neural cell types in primary (left, Braun et al.27) and a selected organoid data set (right, Kanton et al.3). (b) Spearman correlation between average gene expression profiles of neural cell types in HNOCA and those in the primary reference of human developing brain atlas27, across either all the variable genes (left, S1) or variable transcriptional factors (TFs) (right, S3). The average gene expression profile per neural cell type was calculated with all cells (S1) or cells with low glycolysis scores (glycolysis score <0.6, S3). (c) Correlation between different average metabolic scores (up - hallmark glycolysis score, middle - canonical glycolysis score, low - electron transport score) and transcriptomic similarities (Spearman correlation) to primary counterparts. Each dot represents one neural cell type generated by one protocol. The correlation is calculated based on either all variable genes (left, S1) or variable TFs (right, S2). (d) The correlation between hallmark and canonical glycolysis scores and transcriptomic similarities to primary is significantly weaker when only TFs are taken into consideration, while electron transport scores show no correlation with transcriptomic similarities. The boxes show the distributions of correlation when a random subset of variable genes, with the same number as the variable TFs, are used. The red dots show the correlation using variable TFs. (e) Core transcriptomic fidelity of organoid neurons (S2, shown in Fig. 3) which only considers TFs, is higher than the global transcriptomic fidelity (S1) which considers all the highly variable genes. Core transcriptomic fidelity and global transcriptomic fidelity are highly correlated (left, x-axis - S1, y-axis - S2, each dot represents one neural cell type in one HNOCA data set), while core transcriptomic fidelity is significantly higher (right, x-axis: S1, y-axis: S2-S1, dots are colored by density estimated with Gaussian kernel). P-value shows the Wilcoxon test significance.

