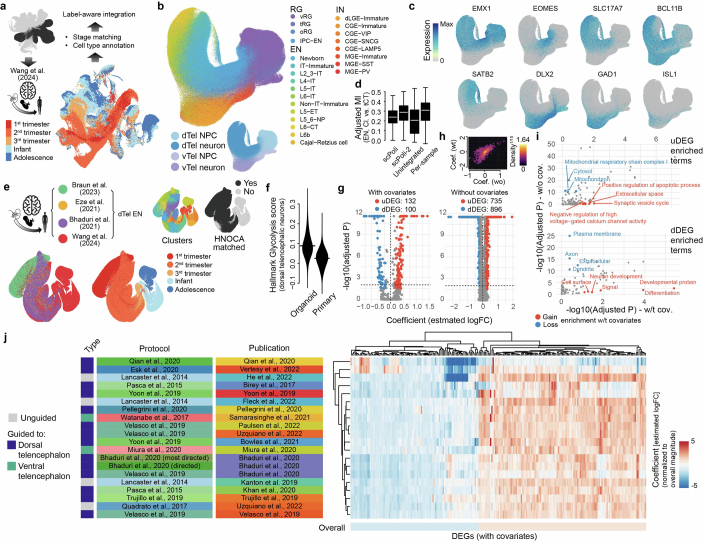
Extended Data Fig. 8. Heterogeneity of telencephalic NPCs and neurons and its incorporation to differential expression analysis between dorsal telencephalic neurons in HNOCA and primary developing human brains.
(a) Overview of mapping the telencephalic NPCs and neurons in HNOCA to the human neocortical developmental atlas30 for cell type annotations. (b) UMAP of cells from the HNOCA telencephalic trajectories, colored by the transferred cell types from the human neocortical developmental atlas (upper) and the HNOCA annotation. (c) UMAP of HNOCA telencephalic cells colored by expression levels of selected cell type markers. (d) Distributions of adjusted mutual information across dorsal telencephalic neurons in different HNOCA samples, between the transferred cell type labels and cluster labels generated with four different representations: 1) the original scPoli (scPoli-1), 2) the re-computed telencephalon-only scPoli based on given the transferred labels; 3) unintegrated PCA of the merged data; 4) PCA and clustering sample-wise. (e) The joint atlas of human neocortical development, colored by data sets, developmental stages, clusters, and whether there is any counterpart in HNOCA dorsal telencephalic neurons. (f) Distribution of the hallmark glycolysis scores in HNOCA and the primary atlas. (g) Volcano plots show the F-test-based DE analysis results, with (left) and without (right) the glycolysis scores and matched cluster labels as covariates. The identified DEGs are colored by red (increased expression in HNOCA) or blue (decreased expression in HNOCA). (i) Changes of functional term enrichment by DAVID for DEGs based on the analysis with or without covariates. The top panel shows enrichments for the up-regulated DEGs (uDEG) in organoids, and the lower panel shows enrichments for the down-regulated DEGs (dDEG). Each dot indicates one functional term with raw P-value < 0.05 for both DEG sets. Red dots indicate functional terms gaining enrichment with DEGs with covariates (with-covariate adjusted Pwt < 0.1, and without-covariate adjusted Pwo>Pwt). Blue dots indicate functional terms losing enrichment with DEGs without covariates (Pwt>0.1 and Pwo < 1 × 10⁻¹⁰). (j) Heatmap shows normalized coefficient (estimated logFC normalized by the overall logFC magnitude) of each DEG per data set. Dendrograms show hierarchical clustering of DEGs and data sets. Rows represent data sets. Side bars on the left are colored based on the types of protocols, individual protocols, and publications corresponding to the data sets. Columns represent DEGs.

