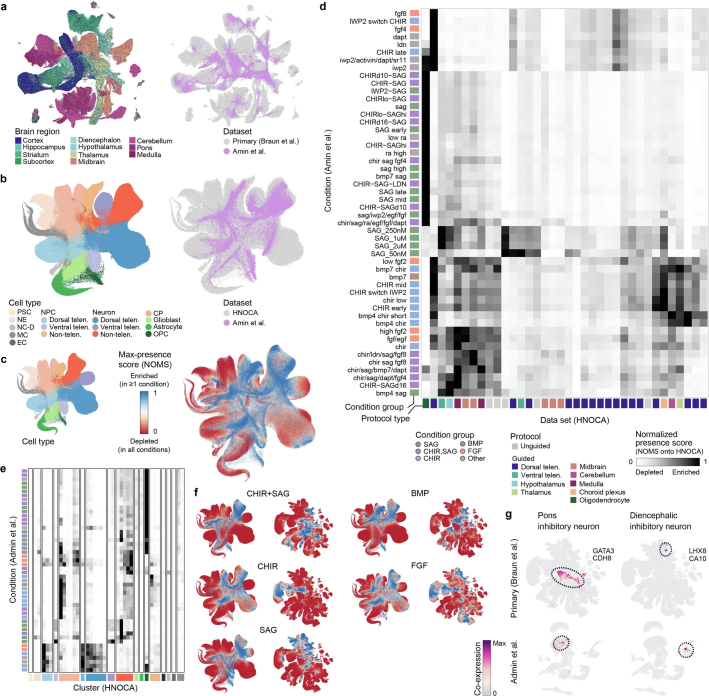
Extended Data Fig. 9. Reference mapping of the neural organoid morphogen screen data to HNOCA and the human developing brain atlas.
(a) UMAP embedding of the human developing brain atlas and neural organoid morphogen screen44 data sets based on the joint scANVI latent space colored by brain region (left) and data set (right). (b) UMAP embedding of HNOCA and the screen data sets based on the joint scPoli latent space colored by annotated cell type (left) and data set (right). (c) scPoli UMAP embedding of the HNOCA colored by cell type (left) and max presence score across all data sets (right). (d) Heatmap showing min-max scaled average presence scores of each condition in the screen data set in HNOCA data sets. (e) Heatmap showing min-max scaled average presence scores of each condition in the screen data set in each leiden cluster in HNOCA, ordered by annotated cell type. (f) UMAP embeddings of HNOCA (left) and the human developing brain atlas (right) colored by presence scores for each condition group in the screen data set. (g) UMAP embeddings of the human developing brain atlas (upper) and screen data set (lower) colored by coexpression scores of clusters with gained coverage in the screen data set.

